Exploring Data with Five Number Summary & Boxplots
Learn how to use statistical tools to understand data characteristics, including the five number summary and boxplot creation methods.

Exploring Data with Five Number Summary & Boxplots
E N D
Presentation Transcript
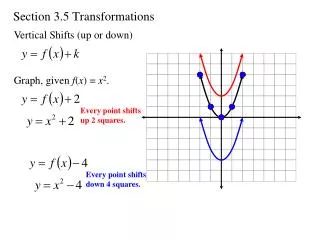
Section 3.5 The Five Number Summary and Boxplots
Exploratory data analysis = the process of using statistical tools (such as graphs, measures of center, and measures of variation) to investigate data sets in order to understand their important characteristics
Five Number Summary Consists of • Smallest data value • Q1 • Median • Q3 • Largest data value
Five Number Summary • Enter data into L1 • “stat” button, choose CALC, choose 1-var Stats, press “enter” button and “enter” button again • This will give you the five number summary: minX = minimum value, maxX = maximum value, Q1=first quartile, Med=second quartile (or median), Q3=third quartile
Boxplot = a graph of a data set that consists of a line extending from the minimum value to the maximum value, and a box with lines drawn at the first quartile, the median, and the third quartile.
Creating a Boxplot (TI-83/84) • Put list in L1 • “2nd” button, “y=“ button • Enter on 1: Plot 1 and choose these options:- ON- Fifth Graph- L1- 1 • “zoom” and then choose “ZoomStat” and “enter” • “Trace” button to view values.
Drawing a Boxplot (By Hand) • Determine the lower and upper fences:Lower fence = Q1 – 1.5(IQR)Upper fence = Q3 + 1.5(IQR) • Draw a number line long enough to include the max and min values. Insert vertical lines at Q1, M, and Q3. Enclose these vertical lines in a box • Label the lower and upper fences • Draw a line from Q1 to smallest data value larger than lower fence. Draw a line from Q3 to largest data value that is smaller than upper fence (whiskers) • Mark any outliers with an asterisk (*)