Micro B3 Information System Bringing sequence data into environmental context
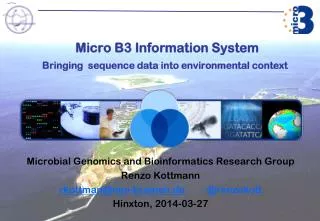
Micro B3 Information System Bringing sequence data into environmental context. Microbial Genomics and Bioinformatics Research Group Renzo Kottmann rkottman@mpi-bremen.de @ renzokott Hinxton , 2014-03-27. Ecosystem Perspective. Data Perspective. genomes. metagenomes. collection date.

Micro B3 Information System Bringing sequence data into environmental context
E N D
Presentation Transcript
Micro B3 Information System Bringing sequence data into environmental context Microbial Genomics and Bioinformatics Research Group Renzo Kottmann rkottman@mpi-bremen.de@renzokott Hinxton, 2014-03-27
Data Perspective genomes metagenomes collection date latitude transcriptomes depth longitude marker genes proteomes water currents temperature Omics Data Environmental Data
Data Perspective genomes metagenomes collection date latitude transcriptomes depth longitude marker genes proteomes water currents temperature Omics Data Environmental Data Result: Relationship
Data Flow Perspective genomes metagenomes collection date latitude transcriptomes depth longitude Knowledge Study marker genes proteomes water currents temperature Field Web Access Omics Data Environmental Data Laboratory Integration Result: Relationship Archival Computing
Data Flow Perspective: Issues genomes metagenomes collection date latitude transcriptomes depth longitude Knowledge Study marker genes proteomes water currents temperature Field Web Access Omics Data Environmental Data • QuantityHeterogeneity • Complexity Laboratory Integration Archival Computing
Data Integration genomes metagenomes collection date latitude transcriptomes depth longitude Knowledge Study marker genes proteomes water currents temperature Field Web Access Omics Data Environmental Data Data Integration + Analysis Laboratory Integration Result: Relationship Archival Computing
Data Integration: Geo-referencing genomes metagenomes t = collection date y = latitude transcriptomes z = depth x = longitude Knowledge Study marker genes proteomes water currents temperature Field Web Access Omics Data Environmental Data Data Integration + Analysis Laboratory Integration Result: Relationship Archival Computing
Micro B3: Biodiversity, Bioinformatics, Biotechnology Knowledge Study Field Web Access Laboratory Integration Archival Computing
Micro B3: Biodiversity, Bioinformatics, Biotechnology Micro B3 Information System
Definition: Information System information system, an integrated set of components for collecting, storing, and processing data and for delivering information, knowledge, and digital products. (http://www.britannica.com/EBchecked/topic/287895/information-system, last visit 2013-03-13)
Information System: Logic View Collecting storing, and processing data and for delivering information modifiedfrom http://martinfowler.com/articles/bigData/
Information System: Process View modifiedfrom http://martinfowler.com/articles/bigData/
Information System: Process View – Data Convergence How to combine heterogeneous data? How to gain useful data? How to gather data? How to find relevant data?
Information System: Process View – Data Divergence How to enhance data? How to find relevant patterns? How to visualize and operationalizeinformation for knowledge creation?
Information System: Science driven Which data? How to process and analyze? What is thegeographic and environmental distribution of my gene? Scientists Generate + = knowledge How to visualize and operationalizeinformation for knowledge creation?
So why all that? • To paraphrase Captain Kirk in the Star Trek: • “Data is a messy business— a very, very messy business.” • episode “A Taste of Armageddon” • “… as much as 60 percent of the time I spend on data analysis is focused on preparing the data for analysis.“ • R in Action: Data analysis and graphics with RbyRobert I. Kabacoff
Gathering & Services Data Tracking Data Services How to analyze, visualize and interpret the sequence data in an environmental context? • How to track the geographic- and environmental origin of DNA sequence data?
Information System: Science driven Which data? How to process and analyze? What is thegeographic and environmental distribution of my gene? Scientists Generate + = knowledge • Data Tracking: • OSD App • OSD Server • Data Services: • Workflows • EATME • ProX
www.oceansamplingday.org Legal Framework ABS, MTA, DTA
Ocean Sampling Day • Global • Standardized • Orchestrated • Sampling event fixed in time • June 21st 2014 www.oceansamplingday.org
Information System: Process View Scientists Generate + = knowledge
Ocean Sampling Day App https://itunes.apple.com/us/app/osd-citizen/id834353532?mt=8 https://play.google.com/store/apps/details?id=com.iw.esa Early, consistent, digital acquisition of environmental data
Features • Allows to take data in the field • NO internet connection needed • GSC standards compliant
Login: Please Use Twitter, Facebook, or Google Just works Out of order • Advantage • You do not need another password • We do not get your password
Information System: Process View Scientists Generate + = knowledge
Data Analysis in Micro B3 Frank Oliver Glöckner
Information System: Process View Scientists Generate + = knowledge
Database Development • PostBIS (Hamburg University) • Efficient storage and retrieval of DNA sequence data • <2 bits per nucleotide base • 500x faster substring operation • rasdaman (Jacobs Unveristy) • Store and retrieve multi-dimensional raster data of unlimited size • Enhancements to SQL interface • http://rasdaman.eecs.jacobs-university.de/trac/rasdaman • PANGAEA (MARUM/ University Bremen) • Lucene based search index
Information System: Process View Scientists Generate + = knowledge
Information System: Process View Scientists Generate + = knowledge
FUNCTIONAL TRAIT-BASED ANALYSIS OF AQUATIC MICROBIAL COMMUNITIES
Functional Traits • Direct link to ecosystem functioning • Ecological trade-offs • What organisms • do, • how many types are needed to maintain ecosystem functioning A functional trait is a well-defined, measurable property of organisms that strongly influences performance. Reiss et al. (2009)
Examples of Metagenomic Traits Explore community traits as ecological markers in microbial metagenomes.(Barberan, Fernandez et al. 2012). • GC (Guanine-Cytosine) content (mean and variance): • Related to genome size, environmental complexity and community composition. • Functional and phylogenetic diversity: • Related to metabolic potential, community composition and environmental biogeochemistry. • Dinucleotide frequency: • Related to phylogenetic composition.
The Metagenomic Trait Workflow(s) • Upstream: • Calculating traits • (traits-analysis workflow) • Downstream • Calculating statistics • (traits-statistics workflow) • R scripts perform multivariate statistic analyses using the vegan package and plot the results using ggplot2