Download
1 / 40
470 likes | 895 Vues
Mean, Median, and Mode. By: Mr. Menjviar. 09/22/11. 09/22/11. Observe, Question, Comment . Mean, Median, and Mode. Mean, Median, and Mode Reflection. Warm-Up:. 13L. 13R. Brain Stimulation. ‘Check Skills You’ll Need’ 3, 4, 5, 6, 6, 8, 9 68, 69, 71, 72, 72 98, 101, 101, 112, 120

E N D
Mean, Median, and Mode By: Mr. Menjviar
09/22/11 09/22/11 Observe, Question, Comment Mean, Median, and Mode Mean, Median, and Mode Reflection Warm-Up: 13L 13R
Brain Stimulation • ‘Check Skills You’ll Need’ • 3, 4, 5, 6, 6, 8, 9 • 68, 69, 71, 72, 72 • 98, 101, 101, 112, 120 • 3, 3.3, 3.7, 3.74, 37
09/22/11 09/22/11 Observe, Question, Comment Mean, Median, and Mode Mean, Median, and Mode Reflection Warm-Up: Standard: 13L 13R
CA Content Standards • Statistics Data Analysis and Probability 1.3: Understanding the meaning of, and be able to compute, the median of a data set
09/22/11 09/22/11 Observe, Question, Comment Mean, Median, and Mode Mean, Median, and Mode Reflection Warm-Up: Standard: Objective: 13L 13R
Objective: • To find the mean, median, mode and range of a set of data
09/22/11 09/22/11 Observe, Question, Comment Mean, Median, and Mode Mean, Median, and Mode Reflection Warm-Up: Standard: Objective: Vocabulary: 13L 13R
Vocabulary:Mean The sum of the data values divided by the number of data values
Vocabulary:Median The middle number when data values are written in order
Vocabulary:Mode The data item that occurs most often. There can be one mode, more than one, or no mode.
Vocabulary:Range The difference between the greatest and least values
09/22/11 09/22/11 Observe, Question, Comment Mean, Median, and Mode Mean, Median, and Mode Reflection Warm-Up: Standard: Objective: Vocabulary: Notes/Examples: 13L 13R
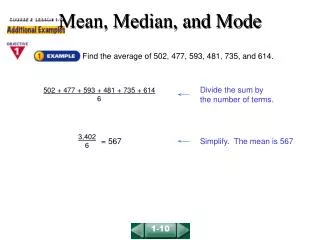
The BASICSYou Must Memorize • Mean = • Median = Middle of the data set • Mode = Value that repeats the most • Range = Highest Value — Lowest Value
Example!!… Let’s take a look at these students that did a Readathon at their school. Find the • Mean • Median • Mode • Range
You Do!!… Let’s take a look at these T-shirt prices that have different colors. Find the • Mean • Median • Mode • Range
You Do!!… Let’s take a look at these T-shirt prices that have different colors. Find the • Mean is $24.40 • Median is $26 • Mode (there is no mode) • Range is $8
09/22/11 09/22/11 Observe, Question, Comment Mean, Median, and Mode Mean, Median, and Mode Reflection Warm-Up: Standard: Objective: Independent Practice: Vocabulary: Notes/Examples: 13L 13R
Independent Practice • Textbook, Pg. 609, #5-13
09/22/11 09/22/11 Observe, Question, Comment Mean, Median, and Mode Mean, Median, and Mode Reflection Warm-Up: Standard: Objective: Independent Practice: Homework: Vocabulary: Notes/Examples: 13L 13R
Homework • Student Workbook, pg. 481 [1a, 2, 4, 6, 7, 8] [Due: Next Meeting]
09/22/11 09/22/11 Observe, Question, Comment Frequency Table and Histogram Frequency Table and Histogram Reflection Standard: 14L 14R
CA Content Standards Statistics Data Analysis and Probability 1.1 Know various forms of display for data sets
09/22/11 09/22/11 Observe, Question, Comment Frequency Table and Histogram Frequency Table and Histogram Reflection Standard: Objective: 14L 14R
Objective: • To display data in frequency tables and histograms
09/22/11 09/22/11 Observe, Question, Comment Frequency Table and Histogram Frequency Table and Histogram Reflection Standard: Objective: Vocabulary: 14L 14R
Vocabulary:Frequency Table It is a table that displays data, which lists each data item with the number of time it occurs.
Vocabulary:Histogram It is a graph that shows the frequencies of data items. The data is often grouped into intervals.
09/22/11 09/22/11 Observe, Question, Comment Frequency Table and Histogram Frequency Table and Histogram Reflection Standard: Objective: Vocabulary: Notes/Examples: 14L 14R
09/22/11 09/22/11 Observe, Question, Comment Frequency Table and Histogram Frequency Table and Histogram Reflection Independent Practice: Standard: Objective: Vocabulary: Notes/Examples: 14L 14R
Independent Practice • Textbook,Pg. 614: #’s 1-8, 10, 12-14
09/22/11 09/22/11 Observe, Question, Comment Frequency Table and Histogram Frequency Table and Histogram Reflection Independent Practice: Standard: Homework: Objective: Vocabulary: Notes/Examples: 14L 14R
Homework • Student Workbook, 12-2, pg. 483 [1, 2, 5]; • pg. 484 [1-6] [Due next meeting]
Exit Slip • Create a Data Set that will have the mean, median and mode to be the same answer • Meaning This: • Mean = Median = Mode
Vocabulary • Mean → the average • Median → the middle • Mode→ the most • Range→ big minus small
Vocabulary (Shout Outs) • Bar Graph → bars to show comparison • Frequency Table → list each item • Histogram→ bar graph with no spaces