Mean, Median, Mode
Mean, Median, Mode. Lesson 6.15. Median. The median is the data point that is in the middle when the data is listed in order (from least to greatest). If there are two numbers in the middle (an even number of items), then find the mean of the two middle numbers. Examples: Find the median.

Mean, Median, Mode
E N D
Presentation Transcript
Mean, Median, Mode Lesson 6.15
Median • The median is the data point that is in the middle when the data is listed in order (from least to greatest). • If there are two numbers in the middle (an even number of items), then find the mean of the two middle numbers.
Examples: Find the median. 13, 16, 17, 19, 25 17 is the median. 3, 5, 6, 9 Here, the 5 and 6 are both in the middle. 5 + 6 = 11. 11 divided by 2 = 5.5. The median is 5.5.
Mode • The mode is the data item that appears the most. • You may have more than one mode.
Example: Find the mode. 5, 4, 6, 11, 5, 7, 10, 5 The mode is 5. 5, 4, 6, 11, 4, 7, 10, 5 The modes are 4 and 5.
Range • The range is the difference (or distance) between the lower extreme (smallest data item) and the upper extreme (largest data item). • You subtract the smallest data item from the largest data item to find the range.
Example: Find the range. 4, 5, 6, 6, 7, 10, 12, 15 The range is the largest data (15) minus the smallest data (4). 15 – 4 = 11 The range is 11.
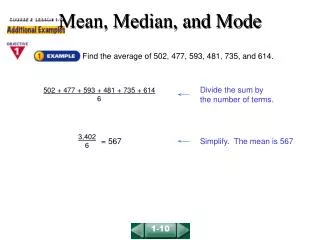
Mean • The mean of a set of data is the average. • Add up all of the data. • Divide the sum by the number of data items you have.
Example: Find the mean. 4, 16, 20, 40 First, add. 4 + 16 + 20 + 40 = 80 There are 4 items. Divide the sum (80) by 4. The mean is 20.
Mean: Fair Share 2009 5.16: The student will a) describe mean, median, and mode as measures of center; b) describe mean as fair share; c) find the mean, median, mode, and range of a set of data; and d) describe the range of a set of data as a measure of variation. Understanding the Standard: “Mean represents a fair share concept of the data. Dividing the data constitutes a fair share. This is done by equally dividing the data points. This should be demonstrated visually and with manipulatives.”
Understanding the Mean • Each person at the table should: • Grab one handful of snap cubes. • Count them and write the number on a sticky note. • Snap the cubes together to form a train.
Understanding the Mean Work together at your table to answer the following question: If you redistributed all of the cubes from your handfuls so that everyone had the same amount (so that they were “shared fairly”), how many cubes would each person receive?
Understanding the Mean What was your answer? - How did you handle “leftovers”? - Add up all of the numbers from the original handfuls and divide the sum by the number of people at the table. - Did you get the same result? - What does your answer represent?
Understanding the Mean Take your sticky note and place it on the wall, so they are ordered… Horizontally: Low to high, left to right; leave one space if there is a missing number. Vertically:If your number is already on the wall, place your sticky note in the next open space above that number.
Understanding the Mean How did we display our data? 2009 3.17c
Understanding the Mean Looking at our line plot, how can we describe our data set? How can we use our line plot to: - Find the range? - Find the mode? - Find the median? - Find the mean?
Mean: Balance Point 2009 6.15: The student will a) describe mean as balance point; and b) decide which measure of center is appropriate for a given purpose. Understanding the Standard: “Mean can be defined as the point on a number line where the data distribution is balanced. This means that the sum of the distances from the mean of all the points above the mean is equal to the sum of the distances of all the data points below the mean.” • Essential Knowledge & Skills: • Identify and draw a number line that demonstrates the • concept of mean as balance point for a set of data.
Where is the balance point for this data set? X X X X
List your data: 2, 3, 5, 6 Find the Mean: 2 + 3 + 5 + 6 = 16 16 4 = 4 X X X X
The Mean is 4. X X X X
Count the distance from each number to the Mean. The number three is 1 space from the mean. X X X X 1 space
Count the distance from each number to the Mean. The number two is 2 spaces from the mean. X X X X 1 space + 2 spaces 3 spaces The total distance from the Mean on this side is 3.
Now do the same thing to the numbers on the other side of the Mean. The number five is 1 space from the mean. X X X X 1 space
Now do the same thing to the numbers on the other side of the Mean. The number six is 2 spaces from the mean. X X X X The total distance from the Mean on this side is also 3. 1 space + 2 spaces 3 spaces
Since the SUM of the distances above and below the Meanare equal, we see that the Mean is the Balance Point. X X X X 3 spaces 3 spaces
Where is the balance point for this data set? (Hint: Calculate the Mean.) 31
We can confirm this by calculating: 2 + 2 + 2 + 3 + 3 + 4 + 5 + 7 + 8 = 36 36 ÷ 9 = 4 4is the Balance Point 32
Where is the balance point for this data set? The Mean is the Balance Point. 33
Assessing Higher-Level Thinking Key Points for 2009 5.16 & 6.15: Students still need to be able to calculate the mean by summing up and dividing, but they also need to understand: - why it’s calculated this way (“fair share”); - how the mean compares to the median and the mode for describing the center of a data set; and - when each measure of center might be used to represent a data set.
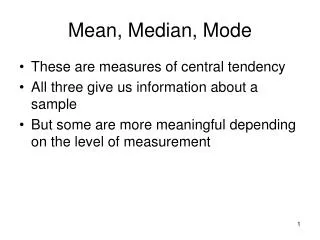
Review What We Learned • Measures of center are types of averages for a data set. They represent numbers that describe a data set. • Mean, median, and mode are measures of center that are useful for describing the average for different situations.
Review What We Learned • Mean works well for sets of data with no very high or low numbers. • Median is a good choice when data sets have a couple of values much higher or lower than most of the others. • Mode is a good descriptor to use when the set of data has some identical values or when data are not conducive to computation of other measures of central tendency, as when working with data in a yes or no survey.
Review What We Learned • The mean is the numerical average of the data set and is found by adding the numbers in the data set together and dividing the sum by the number of data pieces in the set. • In grade 5 mathematics, mean is defined as fair share. • Mean can be defined as the point on a number line where the data distribution is balanced. This means that the sum of the distances from the mean of all the points above the mean is equal to the sum of the distances of all the data points below the mean. This is the concept of mean as the balance point.