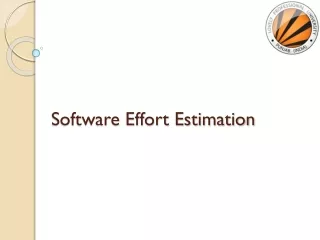
Software Effort Estimation Techniques and Challenges in Project Management
Learn about the key factors influencing successful software project delivery, challenges in estimation, Brooks's Law, Parkinson's Law, efforts estimation techniques, function points, and project planning methods.

Software Effort Estimation Techniques and Challenges in Project Management
E N D
Presentation Transcript
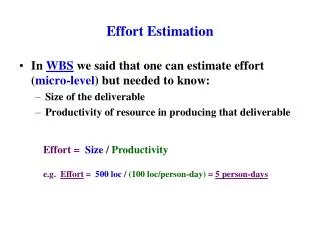
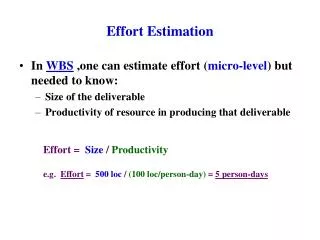
What makes a successful project? Delivering: • Agreed functionality • On time • At the agreed cost • With the required quality
Difficulties with Estimation • Subjective nature of Estimation • Changing Technologies • Political implications
Estimation • Wrong initial estimations • Lead to exceeding deadlines • Over estimation • Under estimation
Over and under-estimating • Parkinson’s Law: ‘Work expands to fill the time available’ • An over-estimate is likely to cause project to take longer than it would otherwise • Brook’s Law: putting more people on late job make it later
Basis for s/w estimation • Need historical data • Measure of work • Only a code measure • Programmer dependent
Software effort estimation techniques • Top-down • Bottom-up
Bottom-up V/S top-down • Bottom-up • use when no past project data • identify all tasks that have to be done – so quite time-consuming • use when you have no data about similar past projects • Top-down • produce overall estimate based on project cost drivers • based on past project data • divide overall estimate between jobs to be done
Bottom-up estimating 1. Break project into small components 2. Stop when you get to what one person can do in one/two weeks 3. Estimate costs for the lowest level activities 4. At each higher level calculate estimate by adding estimates for lower levels
Top-down estimates Estimate 100 days • Produce overall estimate using effort driver(s) • Distribute proportions of overall estimate to components overall project design code test 30% i.e. 30 days 40% i.e. 40 days 30% i.e. 30 days
Function Point Function Count Alan Albrecht while working for IBM, recognized the problem in size measurement in the 1970s, and developed a technique (which he called Function Point Analysis), which appeared to be a solution to the size measurement problem.
Function Count The principle of Albrecht’s function point analysis (FPA) is that a system is decomposed into functional units. • Inputs : information entering the system • Outputs : information leaving the system • Enquiries : requests for instant access to information • Internal logical files : information held within the system • External interface files : information held by other system that is used by the system being analyzed.
User Inquiries Other applications ILF Inputs EIF User Outputs ILF: Internal logical files EIF: External interfaces System Function Count The FPA functional units are shown in figure given below: FPAs functional units System
Function Count The five functional units are divided in two categories: (i) Data function types • Internal Logical Files (ILF): A user identifiable group of logical related data or control information maintained within the system. • External Interface files (EIF): A user identifiable group of logically related data or control information referenced by the system, but maintained within another system. This means that EIF counted for one system, may be an ILF in another system.
Function Count (ii) Transactional function types • External Input (EI): An EI processes data or control information that comes from outside the system. The EI is an elementary process, which is the smallest unit of activity that is meaningful to the end user in the business. • External Output (EO): An EO is an elementary process that generate data or control information to be sent outside the system. • External Inquiry (EQ): An EQ is an elementary process that is made up to an input-output combination that results in data retrieval.
Software Project Planning Counting function points Table 1 : Functional units with weighting factors
Software Project Planning Table 2: UFP calculation table Functional Unit Totals Functional Units Complexity Totals Count Complexity External Inputs (EIs) = Low x 3 Average x 4 = High x 6 = External Outputs (EOs) = Low x 4 Average x 5 = High x 7 = External Inquiries (EQs) = Low x 3 Average x 4 = High x 6 = = Low x 7 External logical Files (ILFs) Average x 10 = High x 15 = = Low x 5 Average x 7 External Interface Files (EIFs) = High x 10 = Total Unadjusted Function Point Count
Software Project Planning Table 3 : Computing function points. Rate each factor on a scale of 0 to 5. 0 1 2 3 5 4 Average Essential Significant No Influence Incidental Moderate Number of factors considered ( Fi ) 1. Does the system require reliable backup and recovery ? 2. Is data communication required ? 3. Are there distributed processing functions ? 4. Is performance critical ? 5. Will the system run in an existing heavily utilized operational environment ? 6. Does the system require on line data entry ? 7. Does the on line data entry require the input transaction to be built over multiple screens or operations ? 8. Are the master files updated on line ? 9. Is the inputs, outputs, files, or inquiries complex ? 10. Is the internal processing complex ? 11. Is the code designed to be reusable ? 12. Are conversion and installation included in the design ? 13. Is the system designed for multiple installations in different organizations ? 14. Is the application designed to facilitate change and ease of use by the user ?
Software Project Planning Functions points may compute the following important metrics: Productivity = FP / persons-months Quality = Defects / FP Cost = Rupees / FP Documentation = Pages of documentation per FP These metrics are controversial and are not universally acceptable. There are standards issued by the International Functions Point User Group (IFPUG, covering the Albrecht method) and the United Kingdom Function Point User Group (UFPGU, covering the MK11 method). An ISO standard for function point method is also being developed.
Software Project Planning Example: 4.1 Consider a project with the following functional units: Number of user inputs = 50 Number of user outputs = 40 Number of user enquiries = 35 Number of user files = 06 Number of external interfaces = 04 Assume all complexity adjustment factors and weighting factors are average. Compute the function points for the project.
FP Solution We know UFP = 50 x 4 + 40 x 5 + 35 x 4 + 6 x 10 + 4 x 7 = 200 + 200 + 140 + 60 + 28 = 628 CAF = (0.65 + 0.01 ΣFi) = (0.65 + 0.01 (14 x 3)) = 0.65 + 0.42 = 1.07 FP = UFP x CAF = 628 x 1.07 = 672
Function points Mark II • Developed by Charles R. Symons • ‘Software sizing and estimating - Mk II FPA’, Wiley & Sons, 1991. • Work originally for CCTA: • should be compatible with SSADM; mainly used in UK • has developed in parallel to IFPUG FPs
Function points Mk II For each transaction, count • data items input (Ni) • data items output (No) • entity types accessed (Ne) #entities accessed #input items #output items FP count = Ni * 0.58 + Ne * 1.66 + No * 0.26
Productivity = size/effort Or Effort=const1+(size*const2)
Inputs:1) Select new sale (control); User action expressed by selection of command [Sale: Receipt_No]. 2) Select product type (business); User choses from categorised drop-down list of pizza related product types [Product: Type_Of_Item]. 3) Select product “name” (business); User choses from a drop-down list of pizza related goods. [Product: Product_Description > Receipt_No & Product_No]. 4) Select number of item (business); Customer may order 3 large margarita pizzas [Item_sale: Quantity_Sold].5) Confirm sale (control); This is a recursive menu selection system. Outputs:1) Error/conformation (control); End of sales data interaction cycle. Entities:1) Sale; Occurrence of a sale recorded here [Write All data].2) Item_sale; Functional relationship to sale entity (List of products for this sales) [Write all data].3) Recipe; Required to determine the inventory items to be subtracted from the inventory_item entity [Read all data]. 4) Inventory_item; Required to change the inventory(stock) level for items used [Read Item_No, Write Quantity_In_Stock] (Quantity of Item x - Recipe:Quantity_Used). 5) System; Provides the automatically generated sales receipt number and Date.
COCOMO COCOMO applied to Semidetached mode Organic mode Embedded mode
COCOMO81 • Based on industry productivity standards - database is constantly updated • Allows an organization to benchmark its software development productivity • Basic model effort = c x sizek • C and k depend on the type of system: organic, semi-detached, embedded • Size is measured in ‘kloc’ ie. Thousands of lines of code
Development effort multipliers (dem) According to COCOMO, the major productivity drivers include: Product attributes: required reliability, database size, product complexity Computer attributes: execution time constraints, storage constraints, virtual machine (VM) volatility Personnel attributes: analyst capability, application experience, VM experience, programming language experience Project attributes: modern programming practices, software tools, schedule constraints
Software Project Planning Multipliers of different cost drivers 1.15 0.75 0.88 1.00 1.40 -- 1.16 1.00 0.94 1.08 -- -- 1.00 1.30 1.65 0.70 0.85 1.15 1.00 1.11 1.30 1.66 -- -- 1.56 -- 1.06 1.21 1.00 -- 1.30 -- 0.87 1.00 1.15 -- 1.00 -- 1.15 0.87 1.07 --
Software Project Planning 0.71 1.00 0.86 -- 1.46 1.19 -- 1.29 1.00 0.91 0.82 1.13 0.70 0.86 -- 1.42 1.00 1.17 -- 1.00 0.90 -- 1.21 1.10 -- 1.14 1.07 1.00 0.95 -- -- 1.24 1.00 0.91 0.82 1.10 -- 0.83 1.24 1.10 1.00 0.91 1.23 -- 1.10 1.04 1.08 1.00 Table 5:Multiplier values for effort calculations
Using COCOMO development effort multipliers (dem) An example: for analyst capability: • Assess capability as very low, low, nominal, high or very high • Extract multiplier: very low 1.46 low 1.19 nominal 1.00 high 0.80 very high 0.71 • Adjust nominal estimate e.g. 32.6 x 0.80 = 26.8 staff months
COCOMOII Stage I In addition to application composition type of projects, this model is also used for prototyping (if any) stage of application generators, infrastructure & system integration. Application composition estimation model Application composition Stage II Early design estimation model Application generators, infrastructure & system integration Used in early design stage of a project, when less is known about the project. Stage III Application generators, infrastructure & system integration Used after the completion of the detailed architecture of the project. Post architecture estimation model Table 8: Stages of COCOMO-II