Effort Estimation
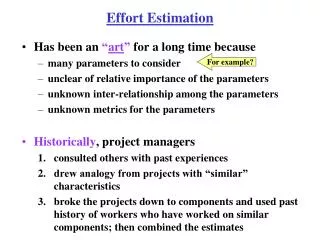
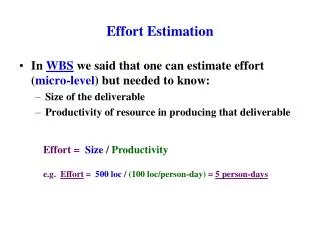
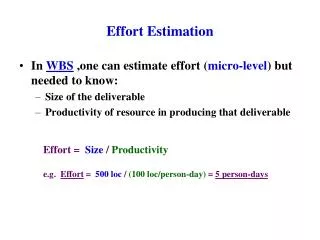
Effort Estimation. Software Effort Estimation. Effort Estimation . Estimating The process of forecasting or approximating the time and cost of completing project deliverables. The task of balancing the expectations of stakeholders and the need for control while the project is implemented

Effort Estimation
E N D
Presentation Transcript
Effort Estimation Software Effort Estimation
Effort Estimation • Estimating • The process of forecasting or approximating the time and cost of completing project deliverables. • The task of balancing the expectations of stakeholders and the need for control while the project is implemented • Types of Estimates • Top-down (macro) estimates: analogy, group consensus, or mathematical relationships • Bottom-up (micro) estimates: estimates of elements of the work breakdown structure
Which view is correct? • Rough order of magnitude is good enough. Spending time on detailed estimating wastes money • Time is everything; our survival depends on getting there first! Time and cost accuracy is not an issue. • The project is internal. We don’t need to worry about cost. • The uncertainty is so great, spending time and money on estimates is a waste. • The project is so small, we don’t need to bother with estimates. Just do it. • They used an internal estimate “for strategic decisions” and then we had to live with it. • We were burned once. I want a detailed estimate of every task by the people responsible.
Macro versus Micro Estimating Conditions for Preferring Top-Down or Bottom-up Time and Cost Estimates Condition Macro Estimates Micro Estimates Strategic decision making X Cost and time important X High uncertainty X Internal, small project X Fixed-price contract X Customer wants details X Unstable scope X
Estimating Projects: Preferred Approach • Make rough top-down estimates. • Develop the WBS/OBS. • Make bottom-up estimates. • Develop schedules and budgets. • Reconcile differences between top-down and bottom-up estimates
Estimating Guidelines for Times, Costs, and Resources • Have people familiar with the tasks make the estimate. • Use several people to make estimates. • Base estimates on normal conditions, efficient methods, and a normal level of resources. • Use consistent time units in estimating task times. • Treat each task as independent, don’t aggregate. • Don’t make allowances for contingencies. • Adding a risk assessment helps avoid surprises to stakeholders.
Refining Estimates • Reasons for Adjusting Estimates • Interaction costs are hidden in estimates. • Normal conditions do not apply. • Things go wrong on projects. • Changes in project scope and plans. • Adjusting Estimates • Time and cost estimates of specific activities are adjusted as the risks, resources, and situation particulars become more clearly defined.
Refining Estimates (cont’d) • Contingency Funds and Time Buffers • Are created independently to offset uncertainty. • Reduce the likelihood of cost and completion time overruns for a project. • Can be added to the overall project or to specific activities or work packages. • Can be determined from previous similar projects. • Changing Baseline Schedule and Budget • Unforeseen events may dictate a reformulation of the budget and schedule.
Project Estimate Times Costs Methods for Estimating Project Times and Costs • Macro (Top-down) Approaches • Consensus methods • Ratio methods • Apportion method • Function point methods for software and system projects • Learning curves
Apportion Method of Allocating Project Costs Using the Work Breakdown Structure
Methods for Estimating Project Times and Costs (cont’d) • Micro (Bottom-up) Approaches • Template method • Parametric Procedures Applied to Specific Tasks • Detailed Estimates for the WBS Work Packages • Phase Estimating: A Hybrid
Duration vs. Effort vs. Productive Time • Duration is the elapsed time in business working days • Work effort is the labor required to complete an activity. Work effort is typically the amount of focused and uninterrupted labor time required to complete an activity. • Productive time considers the percentage of the work day that can be devoted to project activity work. Estimates in IT range from 66-75%, recent estimates of about 50-65% (same client base). This doesn’t include unexpected interruptions!
Software Cost Estimation • What is the Problem? • 100 - 200% cost overruns are not uncommon • 15%of large projects never deliver anything • 31% of new IS projects cancelled before completion ($81 billion) • What are the consequences? • Economic • Technical • Managerial • What is gained through effective software cost-estimation? • schedule/staffing estimates • better understanding of a particular project
Why are we bad at software estimation? • Complexity • Infrequency • Uniqueness • Underestimation bias • Goals not estimates
Basic Steps in Software Estimation • Identify project objectives and requirements • Plan the activities • Estimate product size and complexity • Estimate effort, cost and resources • Develop projected schedule • Compare and iterate estimates • Follow up
algorithmic expert judgement similar, completed projects equate to available resources Price-to-win Top-down (global estimate) Bottom-up (each component separately estimated) Software Cost-Estimation Methods
Algorithmic Models COCOMO TRW (Boehm) ESTIMACS Computer Associates (Rubin) ESTIPLAN AGS Management Systems FAST Freiman Parametric Systems (Freiman) FUNCTION IBM (Albrecht) POINTS MAINSTAY Mainstay Software Corporation PRICE RCA SLIM QSM (Putnam) SOFTCOST-R Reifer Consultants (Tausworthe) SPQR Software Productivity Research (Jones)
Basic Algorithmic Form Effort = constant + coefficient*(size metric) + coefficient*(cost driver 1) + coefficient*(cost driver 2) + coefficient*(cost driver 3) + ….. size metric lines of code ‘new’ versus ‘old’ lines of code function points
SLOC as an Estimation Tool • Why used? • early systems emphasis on coding • Criticisms • cross-language inconsistencies • within language counting variations • change in program structure can affect count • stimulates programmers to write lots of code • system-oriented, not user-oriented
How many Lines of Code in this program? #define LOWER 0 /* lower limit of table */ #define UPPER 300 /* upper limit */ #define STEP 20 /* step size */ main () /* print a Fahrenheit-Celsius conversion table */ { int fahr; for (fahr=LOWER; fahr <= UPPER; fahr=fahr+STEP) printf(“%4d %6.1f\n”, fahr, (5.0/9.0)*(fahr-32)); }
COCOMO Cost Drivers • Required software reliability • data base size • product complexity • computer execution time constraint • computer storage constraint • computer turnaround time • analyst capability • programmer capability • application experience • hardware/software experience • programming language experience • use of modern programming practices • use of software tools • required development schedule
Algorithmic Model Conclusions • Algorithmic Models can do a good job in estimating required effort • Good project data must be collected and analyzed in order to derive useful algorithms • Calibration is essential as the specific environment is critically important • Effort estimates do have other uses • Productivity evaluation of project teams or software development technologies • Objective negotiating tool with users in changes in scope and impact on budget/schedule
Interface Files Internal Inputs Files Queries Function Count Systems View: Functionality Types Outputs
Function Points History • Non-code oriented size measure • Developed by IBM (A. Albrecht) in 1979, 1983 • Now in use by more than 500 organizations world-wide What are they? • 5 weighted functionality types • 14 complexity factors
Functionality Types EXTERNAL USER input type output type inquiry type Internal Logical File External Interface File input type output type inquiry type Application Boundary Other Applications
Each rated on scales equivalent to the following: Not present = 0 Incidental Influence = 1 Moderate Influence = 2 Average Influence = 3 Significant Influence = 4 Strong Influence = 5 Processing Complexity Adjustment 1) data communications 2) distributed functions 3) performance 4) heavily used configuration 5) transaction rate 6) on-line data entry 7) end user efficiency 8) on-line update 9) complex processing 10) reusability 11) installation ease 12) operational ease 13) multiple sites 14) facilitates change
Function Point Calculation Function Counts = Function Points = • where • xi = function i • wj = weight j • ck = complexity factor k
Example - Employee-Job database • Need to track employees and their work • Add, change, delete, queries, and reports • Two types of employees, salaried and hourly • Employees can have more than one job assignment • Standard job descriptions are retained by system • Employees can have more than one location and locations can have more than one employee • Another system stores the location data
Detailed Function Point Counting Rules (1) Internal Logical Files (ILFs) Rules: • Each major logical group of user data or control information • Data is generated, used and maintained by the application In Practice: • Count at logical (external design) level • In DB environment generally a relational table = a logical file (before extensive normalization) • Ignore multiple views
Detailed Function Point Counting Rules (2) External Interface Files (EIFs) Rules: • Files passed or shared between applications • Reference data only (not transactions) In Practice: • Look for “read only” usage • Count special database extracts
Example - ILFs and EIFs • Employee - entity type • Employee name • SSN • Number of dependents • Type (salary or hourly) • Location name (foreign key) • Salaried employee - entity subtype • Supervisory level • Hourly employee - entity subtype • Standard Hourly rate • Collective Bargaining Unit Number
Example - ILFs and EIFs • Job - entity type • Job name • Job number • Pay grade • Job Assignment - entity type • Effective Date • Salary • Performance Rating • Job Number (foreign key) • Employee SSN (foreign key) • Job Description • Job Number (foreign key) • Line number (not known to users) • Description line
Example - ILFs and EIFs • Location - entity --maintained in another system • Location Name • Address • Employee SSN (foreign key) • COUNTING STEPS: • Count number of ILFs and EIFs • Assign them a complexity weighting
Counting ILFs and EIFs • Three ILFs: • Employee • Job • Job Assignment • not Job Description (logically part of Job) • not Location (an EIF) • not Salaried Employee (a Record Element Type) • not Hourly Employee (a Record Element Type) • One EIF: • Location
Counting ILFs/EIFs - Complexity • Three ILFs: • Employee - 8 DETs and 2 RETs • Job - 4 DETs and 1 RET • Job Assignment - 5 DETs and 1 RET • One EIF: Location - 3 DETs and 1 RET
Detailed Function Point Counting Rules (3) External Inputs (EIs) Rules: • Each unique user data/control type that enters application • Adds/Changes/Deletes data in Internal logical file • Each transaction type is an external input In Practice: • Not necessarily equal to screens • Don’t confuse with inquiries (no change to data)
Counting EIs - Raw Data • Employee Maintenance • Add, change, delete Employee • Employee Inquiry; Employee Report Job Maintenance • Add, change, delete Job • Job Inquiry; Job Report Job Assignment Maintenance • Assign Employee to Job • Job Assignment Inquiry; Job Assignment Report • Transfer Employee • Evaluate Employee • Delete Assignment • Location Reporting • Location Inquiry; Location Report
Counting EIs - Complexity • Example EIs (3 of 10): • Create Employee- 10 DETs, 2FTRs (Employee and Location) => Average • Delete Employee- 3 DETs and 1 FTR=> Low • Assign Employee to Job - 6 DETs and 3 FTRs (Employee, Job and Job Assignment)=> High
Detailed Function Point Counting Rules (4) External Outputs (EOs) Rules: • Each unique user data/control type that exits application • Unique means different format or processing logic • Can be sent directly to users as reports/messages, or to other applications as a file In Practice: • Processing must be involved (don’t count output response to an inquiry) • Detail and summary outputs count separately
Counting EOs - Raw Data • Employee Maintenance • Add, change, delete Employee • Employee Inquiry; Employee Report - 6-19 DETs Job Maintenance • Add, change, delete Job • Job Inquiry; Job Report- 5 DETs Job Assignment Maintenance • Assign Employee to Job • Job Assignment Inquiry; Job Assignment Report • Transfer Employee • Evaluate Employee • Delete Assignment • Location Reporting • Location Inquiry; Location Report- 6-19DETs
Counting EOs - Complexity • Example EOs : • Employee Report- 6-19 DETs, 2FTRs (Employee and Location) => Average • Job Report-5 DETs and 1 FTR=> Low • Job Assignment Report - 6-19 DETs, 3 FTRs (Employee, Job and Job Assignment)=> Average
Detailed Function Point Counting Rules (5) External Inquiry (EQ) Rules: • Each unique input/output combination where an input causes and generates an immediate output • Unique means different format or processing logic In Practice: • No processing involved. If result is calculated or derived field, then it is an input and an output • Help systems typically counted as external inquiry • Rate complexity as the higher of the input/output value
Counting EQs - “Medium Cooked” Data • Employee Maintenance • Employee Inquiry- 2 FTRs and 9 DETs (output) Job Maintenance • Job Inquiry - 1 FTR and 4 DETs (output) Job Assignment Maintenance • Job Assignment Inquiry- 1 FTR and 5 DETs (output) • Location Reporting • Location Inquiry - 2 FTRs and 5 DETs (output) RESULT - Use EI and EO matrices => 3 low complexity and 1 average (employee)
Total Unadjusted Function Points 2 6 2 1 3 3 1 3 1 Total = 96 Unadjusted FPs