
Uploaded by
emery-mccall
1 SLIDES
272 VUES
30LIKES
Trained vs. Untrained
DESCRIPTION
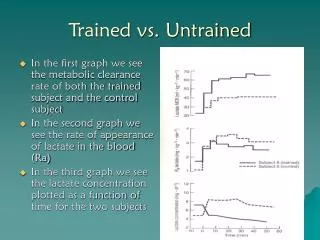
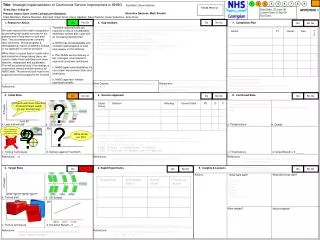
Trained vs. Untrained. In the first graph we see the metabolic clearance rate of both the trained subject and the control subject In the second graph we see the rate of appearance of lactate in the blood (Ra)
Download
1 / 1
Télécharger la présentation 
Trained vs. Untrained
An Image/Link below is provided (as is) to download presentation
Download Policy: Content on the Website is provided to you AS IS for your information and personal use and may not be sold / licensed / shared on other websites without getting consent from its author.
Content is provided to you AS IS for your information and personal use only.
Download presentation by click this link.
While downloading, if for some reason you are not able to download a presentation, the publisher may have deleted the file from their server.
During download, if you can't get a presentation, the file might be deleted by the publisher.
E N D
Presentation Transcript
Trained vs. Untrained • In the first graph we see the metabolic clearance rate of both the trained subject and the control subject • In the second graph we see the rate of appearance of lactate in the blood (Ra) • In the third graph we see the lactate concentration plotted as a function of time for the two subjects


More Related