Download
1 / 12
140 likes | 290 Vues
Quality Improvement (QI). What is it?. Kelly Nagel, MS, LRD QI Council. Agenda. Review QI and Flow chart power point 10 minutes Review Affinity Diagram process 1 0 minutes Break into groups and brainstorm reasons for “delayed reimbursement” 10 minutes

E N D
Quality Improvement (QI) What is it? Kelly Nagel, MS, LRD QI Council
Agenda • Review QI and Flow chart power point • 10 minutes • Review Affinity Diagram process • 10 minutes • Break into groups and brainstorm reasons for “delayed reimbursement” • 10 minutes • Groups post ideas and group ideas (silent consensus) • 20 minutes • Complete Affinity Diagram • Adjourn
QI Definition • It refers to a continuous and ongoing effort to achieve measureable improvements in the efficiency, effectiveness, performance, accountability, outcomes and other indicators of quality in services or processes which achieve equity and improve the health to the community. **Is the work we are doing making a difference or just making work for us to do?
Continuous Improvement PLAN ACT DO CHECK/Study
General Approach “AIM” Issue to Consider Brainstorm & Consolidate Data Cause & Effect Diagram – Greatest Concern Flow Chart Existing Process Monitor new process and Hold the Gains Drill down to root causes Analyze Information and develop solutions Translate Data into Information Flow Chart New Process Gather Data
Travel Reimbursement (Out-of-State) Return from travel Contact Accounting on how to proceed Gather Reciepts No Can you get the required original receipts? Yes No Do you have the required original receipts? 1 Yes 1 Give proper information and documentation to support person. No Do you fill out the travel voucher? 2 2 Yes 2 Complete Travel Voucher and paper clip original reciepts Employee review travel voucher and sign Give to division director and/or section cheif for signatures Employee receives check by inside mail Make copies and date stamp Employee emailed Submit original voucher and original receipts to accounting Accounting picks up check from state treasury office Accounting stamps with date received Employee account credited No Yes Entered int o Peoplesoft No Yes Returned to Employee Unpaid Payment Processed Audited and determined acceptable? Direct Deposit set up for Employee?
Analyzing a Flow Chart • Redundancy • Bottlenecks • Rework loops • Hand-offs • Wait or delays
What is an Affinity Diagram? • A tool for assimilating and understanding large amounts of information. • Group large amounts of ideas, issues, items, or observations into categories for further analysis. • Used to categorize ideas. • Used after brainstorming • Helps to provide direction and overcome team paralysis
How To Do It: • Clearly define the issue to be explored • Issue Statement • Brainstorm ideas/reasons about the issue • Individual silent brainstorming (write each idea on a separate sticky note) • Ideas should be written in more than one word • Post ideas at random • Participants can ask for clarification when idea is read • Silent Consensus • Look for ideas that seem to be related in some way • Move the sticky notes until the notes are grouped • It is ok to have “loners” • It is alright to move notes that someone has already moved • If a note seems to belong in two groups, make a second note • When ideas are grouped, select a heading (categories/themes) for each group • Themes should be at least two words
Draw Finished Diagram • Write a the issue statement at the top of the diagram • Place the header above each group of ideas • Review and clarify the ideas and groupings
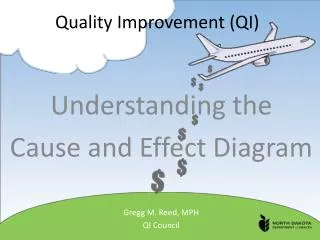
Next QI Tool?? • Cause and Effect Diagram • May 21st • 1 pm to 2 pm • Capital: AV Rooms 210 & 212 • Contact Gregg Reed with questions