Community Attributes
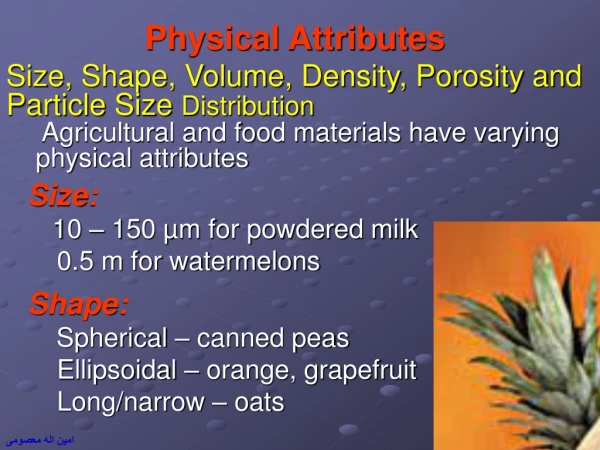
Community Attributes. Kenneth M. Klemow, Ph.D. Wilkes University. Communities defined. Assemblage of interacting populations in an area. Typically categorized according to trophic level / functional group Size of communities varies Depends on size of species and degree of mobility

Community Attributes
E N D
Presentation Transcript
Community Attributes Kenneth M. Klemow, Ph.D. Wilkes University
Communities defined • Assemblage of interacting populations in an area. • Typically categorized according to trophic level / functional group • Size of communities varies • Depends on size of species and degree of mobility • For vegetation, concept of “stand” important • Have important attributes
www.dep.state.fl.us Species composition • List of species in an area. • Can range from monocultures to assemblages of hundreds of species. • Floras and faunas
www.scieng.ed.ac.uk Species area curve • Look at accumulation of species with increasing number of plots sampled • Get saturation effect • Used in conservation biology to predict species loss with habitat loss
Density • Number of individuals in an area • Each broad taxonomic group presents own challenges • Plants - ramets vs genets • Animals - deal with mobility • Fungi - What’s an individual? • Calculate relative density
Frequency • Proportion of times that a species will appear in a defined number of samples.
Concepts relating to frequency • Commonness vs rarity • Common: >60% • Rare: <20% • Raunkiaer’s “law” • A= 0-20% • B= 20-40% • C= 40-60% • D= 60-80% • E= 80-100% • A>B>C=D<E A B C D E
Abundance patterns in communities • Counts of species abundance or frequencies often yield interesting patterns.
Now sort the data • Order of decreasing abundance
And categorize to yield frequency distribution • Place into categories of 25
Now set up categories to follow geometric progression: • 0-1 • 1-2 • 2-4 • 4-8 • 8-16 • 16-32 • 32-64 • 64-128 • 128-256
www.ipgri.cgiar.org Diversity • Measure of heterogeneity among species in a community • Has two components: • Richness • Evenness
Measures of Diversity • Species richness - S • Shannon-Weiner index • H’ = -(pi x ln pi) • Accounts for both richness and evenness • Evenness • J = H’/ln S • Simpson’s index • (pi) • Accounts for dominance • Inverse Simpson’s index • 1/ (pi) • Accounts for diversity
H’ Stress Subsidy Stress-subsidy relationships important
diversity • diversity - within specific community or habitat • diversity - across several communities along a gradient • diversity - across range of habitats in landscape or geographic area
geoggeol.wku.edu Dominance • Degree to which one species intercepts resources and regulates community function • Typically related to biomass • Concept of keystone species
www.epa.gov/nps/ Stability • Ability of a community to remain constant over time, especially in face of perturbation. • Two components: • Resistance • Resilience