Demographics Explaining a Web Survey Entry Selection on the Postal Invitation Letter
ESRA 2019 Zagreb Conference. Session: Challenges and Opportunities of Switching to Web 2. Demographics Explaining a Web Survey Entry Selection on the Postal Invitation Letter. Authors : Arto Selkälä, University Lecturer , University of Lapland , Finland

Demographics Explaining a Web Survey Entry Selection on the Postal Invitation Letter
E N D
Presentation Transcript
ESRA 2019 Zagreb Conference. Session: Challenges and Opportunities of Switching to Web 2 Demographics Explaining a Web Survey Entry Selection on the Postal Invitation Letter Authors: Arto Selkälä, UniversityLecturer, University of Lapland, Finland Ulf-DietrichReips, Professor, University of Konstanz, Germany Leena Viinamäki, PrincipalLecturer, LaplandUniversity of Applied Sciences, Finland Asko Suikkanen,Professor, Emeritus, University of Lapland, Finland
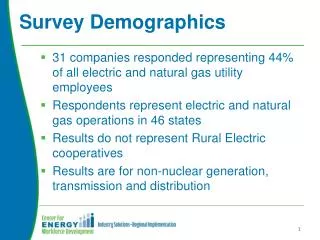
Whatmotivatesourstudy? • Generally declining survey participation rates (e.g. Dillman, Matzat & Reips, 2010). An increased likelihood of nonresponse bias. • Increasing difficulties to reach potential survey participants by traditional methods(For instance: Dillman 2019): • Fewer households have now telephone landlines. • Voice calls from strangers are no longer viewed as normal. • As a consequence people have become less likely to answer their phones. • They instead depend upon messages in order to know it is a legitimate call. • An insufficient understanding of the design issues of a mailed invitation letter in terms of recipients demographic characteristics.
Previousresearchrelated with the presentstudy • A: Preferencestudiesregarding the self-selectionbetweenpapersurvey and websurvey. • B: Invitationmode / prenotificationmodeimpactstudiesregardinginvitationmodeimpact on responserate(email/mail/postcard/mixed). • C: Invitationletterdesign impactstudiesregarding the impact of design elements (etc. subjectline/ textlength) of invitationletterorwebpageon responserate.
Someresults of previousstudies A: Preferencestudies: Diment and Garrett-Jones (2007) found that when respondents were given the choice to complete either web- or paper-based versions of a questionnaire, the majority chose the paper-based mode. Web respondents were more likely to be young, male, middle ranking, and working in information technology–related sectors. Smyth et. al (2010) found that those who preferred to respond by Web in rural communities in the United States were younger (mean age: 51 / mail respondents mean age: 62), more educated, more likely to be married (74 % compared to 43 %) (also Dillman 2015), employed full-time and having higher incomes. However, when controlled for technology use the demographic variables did not have a significant effect on respondents’ chosen response mode. Instead, technology use predicted significantly respondents’ preference in a way that those who frequently need assistance using a computer were 76% less likely to respond via the web.
Someresults of previousstudies B: Invitationmode / prenotificationmodeimpacton responserate. Bosnjaket.al. (2008) foundthatthe combination of SMS prenotificationand e-mail invitation performed best in increasing response rate of the web survey. Bandilla,Couper &Kaczmirek (2012) foundthat a mailed letter, whether as pre-notice or invitation, is more effective than e-mail alone (51 percent vs. 40 percent) in increasing the response rate to the web survey. Kaplowitz et.al. (2012) show(in line with Porter and Whitcomb 2007) that a three-contact mixed-method invitation (use of both postcard and e-mail invitations) work better than three e-mail invitationsin increasing the response rate to a web survey.
Someresults of previousstudies C: Invitationletter design influencesstudyresults. Kaplowitz et al. (2012) found that the URL placement at the bottom of the invitations (email/postcard) is associated with higher response rates for students (difference: 1.4%, p < .10) and faculty (difference: 5.8%, p < .05). Authors argue that placing the URL at the bottom of the invitation encourages recipients to read the entire message, which may increase the legitimacy of the request and motivation for participating. Kaplowitz et al. also found that longer invitation texts(email/postcard)have significant and positive effects on response rates (difference in faculty respondents: 5.6%, staff respondents: 4.4%). In a study by Mavletova et al. (2014) alonger invitation text increased administrative staff start rate. A contrary effect was found among faculty. No effect on the start rate was found among students. Kaplowitzet al. found that an ‘‘authoritative’’ subject line (‘‘MSU Vice President asks you to take a survey’’) significantly increased response rates in all three groups compared to a salient subject request. Joinson & Reips (2007) experimentally determined that power (vice president vs. normal faculty) interacted with personalization in influencing response rates. Mavletova et.al. (2014) found that a ‘‘help’’ request in subject linedid not cause an increase in response rates.
MailedorSMSedinvitationincreasesparticipation • Itoffers a secondcontactchannelappliedtogether with an emailinvitation, henceincreasingattention of recipientstowards the survey(seeBosnjak et. al. 2008). • Itappears as a distinctivemessagein an ongoing stream of of emails and various social media sources(WhatsApp, Twitter, Facebook, SnapChat, Instagram etc.). • For certain people an initial mail contact provides a way of legitimizing the survey request (Bosnjaket. al. 2008; Dillman 2019).
Ourcontribution Despite the progress in the research of invitation mode influence on participating in web surveys, little is yet known about how a postal invitation letter is encountered by invited individuals to the web survey in terms of their characteristics. There is also a lack of studies focusing particularly on selection of entry options on the invitation letter, although the design of invitation letter was shown to affect response rates in both mail surveys and interviewer-administered surveys (e.g., Dillman, 2007; Hembroff, Rusz, Rafferty, McGee & Ehrlich, 2005). The research has also shown that demographic characteristics influence the selection between paper and web surveys in a way that web respondents are more often young, male, middle ranking, employed full-time and working in information technology–related sectors(Diment & Garrett-Jones 2007; Smyth, Dillman, Christian &O’Neill 2010) . Our paper extends the research of invitation methods towards the design of invitation letters in terms of entry options as well the influence of demographic characteristics.
Data and invitationmethod of the presentstudy The studywasconducted as a part of the largerproject: ”The competence-based qualification system for adults – history and effectiveness” - Funded by Finnish National Board of Education. • A three-stage stratified sample of 1329 persons received an advance letter sent by paper mail in order to participate in a web survey that dealt with the Finnish competence-based education system. The sample persons had completed the competence-based education program in 2007.
The entryoptions in detail on the mailedinvitationletter a.Please, write the next address on the web browser address bar and press the enter-button: http://www.webropolsurveys.com/oph.net. After that write the password ”näyttö” to the web page input field and press the “Entry”- button. b. Please send the e-mail with the headline: ”Näyttötutkinto” to next e-mail address: arto.selkala@ulapland.fi. The content in the message is not necessary, the headline is enough. After that you will receive the e-mail that includes the response link to the survey. By clicking the response link you will be able to participate in the survey. c. Please send your personal e-mail address by using the short message service (SMS) to next phone number: XXX-XXXXXXX. After that you will receive the e-mail that includes the response link to the survey.
Researchquestions and hypotheses • Wearefocusingparticularly in the presentstudyhowdifferentdemographic factors affect selection of entry options on the invitation letter. • Weexpectolder and lesseducatedindividualsbenefitingfromcognitively and functionallylessburdeningentryoptions: b (Responselinkbyemail) and c (ResponselinkbySMS) as compared with an option: a(Typing the URL). • Weexpect to findsignificantlyhigherproportions of older and lesseducatedindividualsselectingoptionsb and c.
Method • Observationalstudy. Eachrespondentreceived a similarinvitationlettersentby a postalmail. Proportionsof entry option selections were calculated and statistical significances of them were estimated by a chi square non-parametric test. • In estimating the statistical significance of differences in selection proportions of entry options expected proportions in each category were set equal. This suggests that we assume every option psychologically equivalent in the selection process. • Multinomial and logistic regression modelswerefit in order to explain the selection of entryoptionsbydemographicfactors.
Table 2. Proportions of selected entry options including the no-selection option (Χ² = 1671.611, d.f. = 3, p < 0.001).
Table 3. Observed and expected values of a chi square testexcluding the no-selection option (Χ² = 351,723, d.f. = 2, p < 0.001).
The results of multinomial and logistic regression models to explain the influence of demographicfactors in an entry option selectionon the invitationletter.
The summary of the resultsregardingeducation The odds of selecting the “Response link by email” instead of “Typing the URL” is: ---- 4.1 times higher for those with an elementary school education. ---- 3.18 times higher for those with a basic comprehensive school education. ---- as compared with the participants with high school education (Ref. category). The detailedresults of the finalmodel in Appendix 3.
The summary of theresultsregardingage For every year increase in age, the odds of selecting the “Response link by email” instead of “Typing the URL” increase by approximately 5 percent (p < 0.05). For a 10-year increase in age a corresponding increase in odds is 64 percent ((exp(10 x β)-1) x 100). With our present study we cannot disentangle whether this is an age effect or a cohort effect. • The detailedresults of the finalmodel in Appendix 3.
Conclusions and recommendations Among invited individuals “Typing the URL” option was selected most frequently (22.3 %) from all available options. The second most frequent selection was “Responselinkbyemail” (4.1 %) while the ”ResponselinkbySMS” selectionwasleastfrequent (2.0 %). The factors education and age explained an entry option selection as follows. Older and less educated individuals favored sending an email to the researcher in order to receive an email including the response link to the web survey instead of typing the URL address on the web browser address bar. This suggests that entering a complex URL address into the web browser address bar - a cognitively more burdening task than sending an email to the researcher in order to receive an e-mail in return – may be perceived as more burdening by older or more experienced users. They may also be willing to act more according to these expectations. Therefore we recommend that researchers offer alternative and cognitively less demanding entries with the URL address on invitation letter especially in general population web-push surveys.
To becontinued.. An experimental study of a selection of entry options will be conducted and presented. Manythanks for yourattention!
References • Bandilla, W., Couper, M. P., Kaczmirek, L. (2012). The mode of invitation for web surveys. Survey Practice, 5 (3). • Bosnjak, M., Neubarth, W., Couper, M. P., Bandilla, W., Kaczmirek, L. (2008). Prenotification in Web-Based Access Panel Surveys. Social Science Computer Review, 26 (2). • Dillman, D. (2007). Mail and Internet surveys: The tailored design method (2nd ed.). New York, NY: John • Wiley. • Dillman, D. A., Reips, U.-D., & Matzat, U. (2010). Advice in surveying the general public over the Internet. International Journal of Internet Science, 5, 1-4. • Dillman, D. (2015). Mixed-Mode Solutions to the People Problems Facing Web Surveys. WEBDATANET. Salamanca, Spain, May 27, 2015. • Dillman, D. (2019). Web-Push Surveys; Origins, Uses and Unsolved Challenges 2019 JPSM Distinguished Lecture. University of Maryland April 12, 2019. • Diment, K., & Garrett-Jones, S. (2007). How demographic characteristics affect mode preference in a postal/web mixed-mode survey of Australian researchers. Social Science Computer Review, 25, 410–417. • Joinson, A. N., & Reips, U.-D. (2007). Personalized salutation, power of sender and response rates to Web-based surveys. Computers in Human Behavior, 23(3), 1372-1383. doi:10.1016/j.chb.2004.12.011 • Hembroff, L. A., Rusz, D., Rafferty, A., McGee, H., & Ehrlich, N. (2005). The cost-effectiveness of alternative advance mailings in a telephone survey. Public Opinion Quarterly, 69, 232–245. • Kaplowitz, M., D., Lupi, F., Couper, M. P., & Thorp, L. (2012). The effects of invitation design on web survey response rates. Social Science Computer Review, 30, 339–349. • Mavletova, A., Deviatko, I. & Maloshonok, N. (2014). Invitation Design Elements in Web Surveys – Can One Ignore Interactions? Bulletin de Me´thodologieSociologique, 123, 68-79. • Porter, S. R. & Whitcomb, M. E. (2007). Mixed-mode contacts in web surveys. Paper is not necessarily better. Public Opinion Quarterly, 71, 635–648. • Smyth, J. D., Dillman, D. A., Christian, L. M. & O’Neill, A. C. (2010). Using the internet to survey small towns and communities: Limitations and possibilities in the early 21st Century. American Behavioral Scientist, 53, 1423–1448.
Appendix 2. Model 2. Multinomiallogistic regression model for a web survey entry selection after excluding sex as a non-significant predictor.
Appendix 3. Model 3. Logisticregression model for a web survey entry selection after dropping the comparison of “Response link by SMS” and “Typing the URL” due to no significant predictors.