
Uploaded by
emily
12 SLIDES
297 VUES
120LIKES
Compare 9798
DESCRIPTION
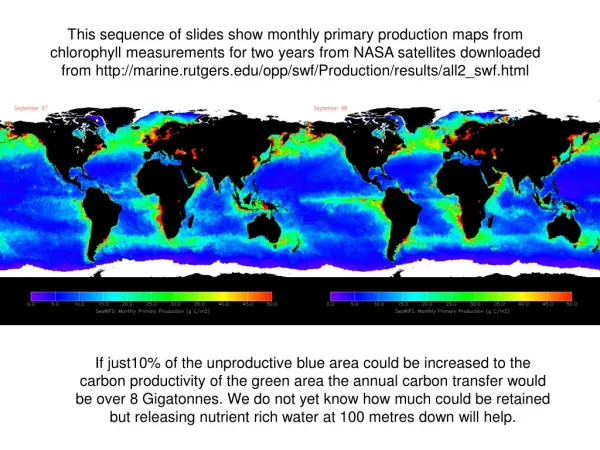
This sequence of slides show monthly primary production maps from chlorophyll measurements for two years from NASA satellites downloaded from http://marine.rutgers.edu/opp/swf/Production/results/all2_swf.html.
Download
1 / 12
Télécharger la présentation 
Compare 9798
An Image/Link below is provided (as is) to download presentation
Download Policy: Content on the Website is provided to you AS IS for your information and personal use and may not be sold / licensed / shared on other websites without getting consent from its author.
Content is provided to you AS IS for your information and personal use only.
Download presentation by click this link.
While downloading, if for some reason you are not able to download a presentation, the publisher may have deleted the file from their server.
During download, if you can't get a presentation, the file might be deleted by the publisher.
E N D
Presentation Transcript
This sequence of slides show monthly primary production maps from chlorophyll measurements for two years from NASA satellites downloaded from http://marine.rutgers.edu/opp/swf/Production/results/all2_swf.html If just10% of the unproductive blue area could be increased to the carbon productivity of the green area the annual carbon transfer would be over 8 Gigatonnes. We do not yet know how much could be retained but releasing nutrient rich water at 100 metres down will help.


More Related