Download

1 / 38
380 likes | 401 Vues
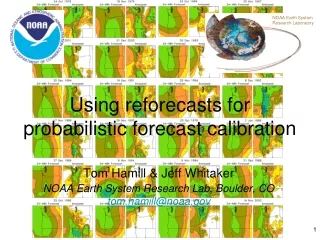
NOAA Earth System Research Laboratory. Probabilistic QPFs for the Indian Monsoon using Reforecasts. Tom Hamill NOAA / ESRL tom.hamill@noaa.gov. Outline. Background Why reforecasting? NOAA’s reforecast data set.

E N D
NOAA Earth System Research Laboratory Probabilistic QPFs for the Indian Monsoon using Reforecasts Tom Hamill NOAA / ESRL tom.hamill@noaa.gov
Outline • Background • Why reforecasting? • NOAA’s reforecast data set. • How skill can be overestimated using the conventional method of applying metrics • Monsoon climatology • Logistic regression review • Results • Stepwise elimination : logistic regression results • Brier skill scores and forecast reliability, before and after calibration using logistic regression • Some examples of actual calibrated forecasts
Problem with current ensemble forecast systems Forecasts may be biased and/or deficient in spread, so that probabilities are mis-estimated. “Calibration” (statistical correction) needed. Heavy rain in an area where none of the ensemble members predicted it. http://www.spc.noaa.gov/exper/sref/
This article on reforecasting in the Bulletin of the American Meteorological Society is a good place to start for an overview.
NOAA’s reforecast data set • Model: T62L28 NCEP GFS, circa 1998 • Initial States: NCEP-NCAR Reanalysis II plus 7 +/- bred modes. • Duration: 15-day integrations every day at 00Z from 19781101 to now. (http://www.cdc.noaa.gov/people/jeffrey.s.whitaker/refcst/week2). • Data: Selected fields (winds, hgt, temp on 5 press levels, precip, t2m, u10m, v10m, pwat, prmsl, rh700, heating). NCEP/NCAR reanalysis verifying fields included (Web form to download at http://www.cdc.noaa.gov/reforecast). Data saved on 2.5-degree grid. • Experimental precipitation forecast products: http://www.cdc.noaa.gov/reforecast/narr .
Reforecast data was archived on global domain. For this experiment we saved forecast total precipitation, column precipitable water, and sea-level pressure tendency) on coarse and fine grids, as shown, for May 15 - Oct 15, 1979-2007. 1.0° 2.5°
Overestimating skill: a review of the Brier Skill Score Brier Score: Mean-squared error of probabilistic forecasts. Brier Skill Score: Skill relative to some reference, like climatology. 1.0 = perfect forecast, 0.0 = skill of reference.
Overestimating skill: another example 5-mm threshold Location A: Pf= 0.05, Pclim= 0.05, Obs = 0 Location B: Pf= 0.05, Pclim= 0.25, Obs = 0 why not 0.48? Locations A and B:
An alternative BSS Say m overall samples, and k categories where climatological event probabilities are similar in this category. ns(k) samples assigned to this category. Then form BSS from weighted average of skills in the categories. (for more details on all of this, see Hamill and Juras, QJRMS, October C, 2006)
Logistic regression • Predictors tested: √(ensemble-mean precip), precipitable water, SLP tendency • Observed data: Indian precipitation analyses on 1-degree grid, 1979-2004 • Stepwise elimination to determine which predictors are useful. • Train with data +/- 10 days around date of interest. Cross validated, so, for example, regression coefficients for 1979 were trained on 1980-2004 data. • Test June 1 - October 1, 1979 - 2004. where x1, xn are model predictors, betas are fitted regression coefficients. Used NAG library routine.
Which predictors in logistic regression with stepwise elimination? Day 1 For every day of the monsoon season, a stepwise linear regression was run to determine which predictors provided a reduction in error. As shown, a power-transformed ensemble- mean forecast precipitation was uniformly selected as an important predictor. Precipitable water was occasionally selected, and sea-level pressure change was virtually never selected. Based on these results, all subsequent logistic regression analyses will be based on using only one predictor, the power- transformed ensemble-mean precipitation amount.
Which predictors in logistic regression with stepwise elimination? Day 3 The same conclusion is reached when considering other forecast leads.
Brier Skill Scores Confidence intervals are so small they don’t show up on the plot.
Reliability, Ens. Relative Frequency, 1 and 5 mm solid lines: frequency distribution of climatology 5, 95 percent confidence intervals via block bootstrap.
Map of Logistic Regression BSS, Day 1 Note: This method of calculating BSS lumps all samples at a particular grid point together for dates between 1 May and 1 October. To the extent that the climatological event probability varies over this range of dates, the BSS may be somewhat inflated. Please read Hamill and Juras, QJRMS, Oct (c) 2006.
Monthly variations of skill, 10 mm More skill later in the monsoon season.
Conclusions • Precipitation probabilities estimated directly from the ensemble are very unreliable and unskillful because of substantial model deficiencies (coarse resolution, sub-optimal model physics, methods of generating ensemble, limited ensemble size). • With a large data set of past forecasts (“reforecasts”) using the same model that is run operationally (here, a 1998 version of NCEP’s GFS), the model forecasts can be post-processed to yield reliable and somewhat skillful probabilistic forecasts. • The 1st-generation NOAA reforecast model is out of date, but there is growing interest worldwide in producing reforecast data sets with current models (e.g., ECMWF will produce limited reforecasts starting in 2008).
References(downloadable from www.cdc.noaa.gov/people/tom.hamill/cv.html) • Hamill, T. M., J. S. Whitaker, and X. Wei, 2004: Ensemble re-forecasting: improving medium-range forecast skill using retrospective forecasts. Mon. Wea. Rev., 132, 1434-1447. • Hamill, T. M., J. S. Whitaker, and S. L. Mullen, 2006: Reforecasts, an important dataset for improving weather predictions. Bull. Amer. Meteor. Soc., 87, 33-46. • Hamill, T. M., and J. S. Whitaker, 2006: Probabilistic quantitative precipitation forecasts based on reforecast analogs: theory and application. Mon. Wea. Rev.,134, 3209-3229. • Hamill, T. M., and J. Juras, 2006: Measuring forecast skill: is it real skill or is it the varying climatology? Quart. J. Royal Meteor. Soc., 132, 2905-2923. • Wilks, D. S., and T. M. Hamill, 2007: Comparison of ensemble-MOS methods using GFS reforecasts. Mon. Wea. Rev., 135, 2379-2390. • Hamill, T. M., and J. S. Whitaker, 2006: Ensemble calibration of 500 hPa geopotential height and 850 hPa and 2-meter temperatures using reforecasts. Mon. Wea. Rev., 135, 3273-3280 • Hagedorn, R, T. M. Hamill, and J. S. Whitaker, 2007: Probabilistic forecast calibration using ECMWF and GFS ensemble forecasts. Part I: 2-meter temperature. Mon. Wea. Rev., accepted. • Hamill, T. M., R. Hagedorn, and J. S. Whitaker, 2007: Probabilistic forecast calibration using ECMWF and GFS ensemble forecasts. Part II: precipitation. Mon. Wea. Rev., accepted.