Download
1 / 54
570 likes | 810 Vues
Prediction of the Indian Monsoon. Sulochana Gadgil 4 July 2011. Traditional forecasters Nandiwallas. ‘ I seek the blessings of Lord Indra to bestow on us timely and bountiful monsoons'

E N D
Prediction of the Indian Monsoon SulochanaGadgil 4 July 2011
‘I seek the blessings of Lord Indra to bestow on us timely and bountiful monsoons' Finance Minister PranabMukherjee, budget speech in the LokSabha, Feb 2011
Outline • What are we trying to predict? • Why? • Current State of Art: How good are the predictions? • Background about the system responsible for the monsoon • Challenge of improving predictions
Note that most of the rainfall occurs during June-September i.e. the summer monsoon season
Monsoon Prediction: • All-India average of the summer monsoon (June-September) rainfall (ISMR) (i) long term mean =85.24 cm; (ii) standard deviation =10% of the mean The Indian summer monsoon is one of the most reliable elements of the tropical climate! ISMR <90% : Drought ISMR> 110%: Excess rainfall season 90%< ISMR< 110% : normal monsoon
Interannual Variation of the anomaly of ISMR (as % of the mean); (std dev is about 10% of mean) Monsoon of 2009 is the one of the top five most severe droughts during 1876-2009
Despite the monsoon being so reliable, why, is there so much demand for predictions? The vagaries of the monsoon have a very large impact. How large is the impact? • Quantitative assessment of the impact of the monsoon on GDP and agriculture: • The Indian Monsoon, GDP and Agriculture • Gadgil, Sulochana and Siddhartha Gadgil, (2006) • Economic and Political Weekly, XLI, 4887-4895.
There is a marked asymmetry in the response to monsoon variability, with the magnitude of the negative impact of a drought being more than that of the positive impact of a surplus. Unless this situation changes, it will not be possible to maintain the growth rate of food grain production at an adequate level for ensuring food security. • The most striking feature we observed is that the impact of a severe drought on GDP has remained between 2 to 5% for the last five decades, despite the marked decrease in the contribution of agriculture to economy. This is because agriculture also has an indirect impact on GDP, since even now the livelihood of over 60% of the population depends on it.
We estimated that for a drought of moderate intensity (ISMR deficit ranging from 10% to 15%), at current levels of the economy and production, the impact on GDP at 2006 prices is around Rs. 50,000 crores or more and FGP deficit of around 10 million tons in food grain production. • Thus prediction of the interannual variation of ISMR and particularly for the occurrence/nonoccurrence of the extremes (i.e. droughts and excess rainfall seasons) continues to be extremely important even in the modern era.
How good are the predictions of the monsoon? Consider the experience of 2009. Monthly/seasonal anomalies of all-India rainfall (as %age of the mean) • June: - 47 % • July: -4.% • August: -28% • September : -21% • Seasonal (June-September) : - 23% • June-August: -36%
Monsoon 2009 The Indian summer monsoon (June-Sept) rainfall(ISMR) in 2009 was 77% of its long period average i.e. deficit of 23%
Prediction with atmospheric and coupled general circulation models • Predictions for the rainfall over the Indian region made in April and May made with atmospheric and coupled models as well as multi-model ensembles from different centres of the world are available for the rainfall during June-August 2009 (and not the entire summer monsoon i.e. June-September) in the public domain. • Almost all the models predicted for June-August 2009 (for which the observed all-India rainfall was deficit by 36%) not a deficit (leave alone a severe drought), but rather above average rainfall over the Indian region.
As in 2009, the atmospheric and coupled models at the major global centres had failed to predict deficit rainfall during the last two droughts i.e. last severe drought of 2002 and also the drought of 2004. • Why is the skill so poor? How do we improve it? • Improving models, data and data assimilation
Improving models: • Improving parameterizations which are known to be important for tropical systems –such as cumulus parameterization • To improve the simulation of the major phenomena/modes of importance to monsoon variability and their links with the monsoon • Data Assimilation : Assimilation of which facets of the ocean-atmosphere system is critical?
What do we understand about the Monsoon: the system and its variability?
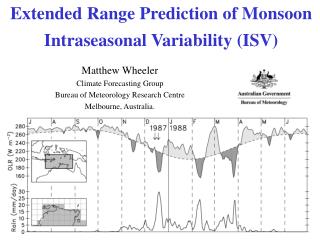
System responsible for the monsoon Large-scale monsoon rainfall occurs in association with a planetary scale dynamical system-the tropical convergence zone (TCZ) which stretches from over the Indian monsoon zone across the Bay and thence across the equatorial Pacific.
Satellite derived Outgoing Longwave Radiation (OLR) is generally used as a proxy for rainfall in the tropics. Regions with deep convective clouds are characterized by low OLR.
Almost all the cloud systems that give rain over the Indian region, are born over the surrounding warm ocean. Hence the variability of the large-scale monsoon rainfall is linked to the variability of clouding over the equatorial Indian Ocean ,the Arabian Sea and the Bay of Bengal. • The variability of monsoon rainfall is also related to the variability of the clouding over the equatorial Pacific Ocean. The dominant signal of the interannual variation of the coupled atmosphere–ocean system over the Pacific is the El Nino Southern Oscillation (ENSO) phenomenon.
Interanual Variation of ISMR • Important Links: • Linked to El Nino Southern Oscillation –higher propensity of droughts during El Nino and of excess monsoon rainfall in La Nina • Also linked to another mode discovered recently viz. EQUINOO
Correlation of OLR with ENSO index for JJAS Note that convection over the entire region (i.e. eq. Indian Ocean, Indian region, Arabian Sea, Bay of Bengal) is suppressed (enhanced) during El Nino (La Nina)
EQUINOO :OLR anomalies WEIO EEIO July 2002 August 1994
Equatorial Indian Ocean Oscillation (EQUINOO)* • When the convection over WEIO (50°–70°E, 10°S–10°N) is enhanced, convection over EEIO (90°–110°E, 0°–10°S)is suppressed. • Associated with this, changes occur in the sea level pressure gradient and in the zonal component of the surface wind over the central equatorial Indian Ocean. Enhancement of convection over WEIO (EEIO) and suppression over EEIO (WEIO) is associated with negative (positive) anomalies of this component of surface wind. • We call this oscillation as Equatorial Indian Ocean Oscillation (EQUINOO). • ----------------------------------------------------------------------- • *Gadgil et. al 2003,2004, Ihara et. al 2007
We use EQWIN an index of EQUINOO, defined as the negative of the anomaly of the surface zonal wind averaged over 600E-900E:2.50S-2.50N, normalized by its standard deviation. • 1negative (so that positive values of EQWIN imply favourable for the monsoon), EQWIN=2.03
Correlation of OLR with EQWIN for JJAS EQUINOO involves convection anomalies of opposite signs over WEIO and EEIO
ISMR in ENSO index-EQWIN plane Red blobs droughts, brown: severe droughts; Blue blobs :excess;dark blue:large excess after Gadgil et al GRL2004
Special Years 1988, 1961: excess monsoon both ENSO and EQUINOO favourable 1994 : excess monsoon with EQUINOO favourable but ENSO unfavourable 2009 (as all severe droughts): both unfavourable 1985: drought with EQUINOO unfavourable but ENSO favourable
1988: excess monsoon AMIP results Atmospheric GCMs run with observed SST
Thus the skill of atmospheric models in simulating droughts/excess rainfall seasons associated with ENSO is higher than the skill in simulating extremes associated with EQUINOO. Need to improve simulation of the link with EQUINOO. • This was suggested in : • Monsoon prediction – Why yet another failure? • SulochanaGadgil*, M. Rajeevan and Ravi Nanjundiah • CURRENT SCIENCE, 2005, VOL. 88, p1389-1400
Retrospective predictions with CFS Note : correct prediction for 1994, but terrible for 2009
1994: Strong Positive Indian Ocean Dipole (IOD) event CLIM 1994 Reversal of SST and OLR gradients over the equatorial Indian Ocean
Indian Ocean Dipole (IOD) events: 1994,97 Cold SST anomaly and suppressed convection over EEIO
SST-Convection relationship: highly nonlinear SST Threshold:27.50 C (Gadgil , Joseph and Joshi: Nature 1984)