Download
1 / 17
170 likes | 336 Vues
The Digital Transition: Before & After. The Digital Transition: Before & After. Who was effected by the digital transition? Where did these viewers go? How has this effected television viewing so far?. What was the Digital Transition and how many people were effected?.

E N D
The Digital Transition: Before & After • Who was effected by the digital transition? • Where did these viewers go? • How has this effected television viewing so far?
What was the Digital Transition and how many people were effected?
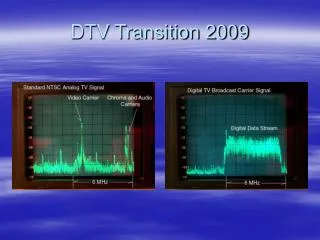
What was the Digital Transition? The government mandated that by June 12, 2009 all television signals must be digital As a result, any television set that did not have a digital receiver would lose reception after that deadline Since the majority of broadcast-only homes had TV sets that could only receive an analog signal they had to make a choice…
Digital Converter Satellite Broadcast-Only Homes Had Three Choices 1. Subscribe to Wired Cable Broadcast Only Home 2. Subscribe to Satellite 3. Purchase a digital converter
Over 10 Million Homes Made This Choice Households With Completely Unready Sets Nielsen People Meter Sample # of TV Homes % of TV Homes January ‘08 10.5% 11.9 Million January ‘09 5.7% 6.4 Million July ‘09 1.3% 1.5 Million Source: Nielsen Digital Transition presentation, July 2009 Note: Number of Homes estimated from Nielsen People Meter Sample, actual number may vary
What About the Million Homes Who Still Aren’t Ready? Households With Completely Unready Sets Nielsen People Meter Sample # of TV Homes % of TV Homes January ‘08 10.5% 11.9 Million January ‘09 5.7% 6.4 Million July ‘09 1.3% 1.5 Million Source: Nielsen Digital Transition presentation, July 2009 Note: Number of Homes estimated from Nielsen People Meter Sample, actual number may vary
What About the Million Homes Who Still Aren’t Ready? • Low power and translator stations were not required to transition on June 12th • Therefore, a small section of homes in rural areas can receive a few channels through an analog signal from these stations • - 60% of completely unready homes as of June 28, 2009 receive at least one low power station • At this time, it is uncertain when these stations will officially transition Source: Nielsen Digital Transition presentation, July 2009
Although the Majority Acquired a Digital Tuner, Wired Cable Picked Up Over 20% of Homes Conversions as of June 2009 (# of Homes Estimated from Nielsen People Meter Sample) % of Converted TV Homes Acquired a Digital Converter 65.7% Acquired Hard-Wired Cable 23.3% Acquired Satellite (DBS) 10.8% Acquired other ADS (SMATV) 0.2% Source: Nielsen Digital Transition presentation, July 2009
Since January ’08 Wired Cable Has Picked Up Over One and One-Half Million Homes # of Wired Cable Households (000) 71,137 70,171 69,441 +966,000 homes vs. Jan ‘09 +730,000 homes vs. Jan ‘08 1,696,000 homes since Jan. ‘08 Source: Nielsen NPM
Wired Cable Added 365,000 More Homes Than Satellite # of Households (000) January 2008 August 2009 Difference Wired Cable 69,441 71,137 +1,696 ADS 31,495 32,826 +1,331 Broadcast Only 11,864 10,537 -1,327 114,500 112,800 Total Homes: Source: Nielsen NPM
Wired Cable Currently Accounts for 62% of All Homes % of Households January 2008 August 2009 Source: Nielsen NPM
How Will TV Viewing Be Effected by the Influx of New Homes to Cable?…It’s too early to know for certain but short term indications are positive…
Broadcast-Only Homes Had Limited Viewing Options Before… Before the transition, 100% of viewing went to Broadcast stations… Among consumers who chose Wired Cable (only local ad insertion option)… Share of viewing before and after transition on television sets that were Unready during the entire week of May 19th through May 25th, 2008 and Ready during the entire week of April 20th through April 26th, 2009 (based on Unified NPM Total U.S. sample during those two weeks)
What Happens When You Give Them More Choice? They flip the channel from Broadcast to Cable… Over 70% of their viewing moved to Cable! Among consumers who chose Wired Cable (only local ad insertion option)… Share of viewing before and after transition on television sets that were Unready during the entire week of May 19th through May 25th, 2008 and Ready during the entire week of April 20th through April 26th, 2009 (based on Unified NPM Total U.S. sample during those two weeks)
Final Thoughts • Broadcast network performance showed a decline in weeks after the transition…time will tell how much is due to changed viewing behavior • The Nielsen Universe Estimates will be updated on a rolling basis therefore in the upcoming periods the Wired Cable UE is expected to increase