Understanding Index Earnings: A Guide for Investment Banking Interns
240 likes | 373 Vues
This resource provides an essential overview of index earnings, crucial for company valuation in investment banking. Learn the importance of index earnings, how to copy critical data to your spreadsheet, and the methodology for calculating index earnings for companies with non-December fiscal year ends. Discover how to access historical and forecast earnings estimates using Bloomberg. Gain insights into the significance of index earnings relative to earnings per share, and understand the implications for forecasting and comparing companies in the market.

Understanding Index Earnings: A Guide for Investment Banking Interns
E N D
Presentation Transcript
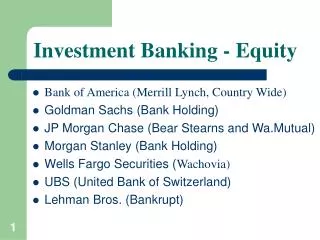
Investment Banking Internship Class Benchmark Index Earnings
Objectives A. Know the importance of index earnings in company valuation B. Know how to copy data to your spreadsheet C. Know how to calculate index earnings for companies with non-December fiscal year-ends
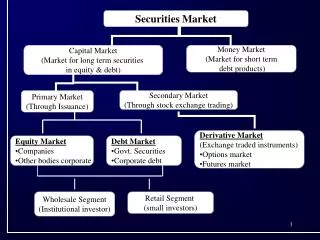
Understand the Importance of Index Earnings • What are index earnings? • Index earnings are the calculated earnings of a specific benchmark. • Each benchmark will have a different index earnings • Actual numbers are not important—but the level of the index earnings is important • Why are index earnings important? • Index earnings are a level of earnings, and from this we can determine earnings growth and earnings stability for an index • You can also forecast index earnings, so you can compare a company’s forecast PE with the market forecast PE.
Index Earnings (continued) • How are index earnings calculated? • Index earnings are calculated by dividing the index level, i.e. the S&P500 at 1,230, by the PE of the chosen index, i.e. the S&P500 at 20x. • The index divided by the PE give the index earnings, i.e., 1,230 / 20 = 61.5 • What is it comparable to? • It is comparable to the Earnings Per Share for a specific company
Know how to copy data to your spreadsheet Where do you get index levels? • Go to Bloomberg, type your index, i.e. SPX [index] and go. • Then type “HP” for historical prices • Tab to the date Range and put in “96” for 10 years. • Determine your Fiscal Year End from your company reports • Copy the Index levels to your spreadsheet • Assuming a September year-end (see the green circles) • Do not forget today’s price as well (see the red circle) • Note: I have also included this information in the FR-CR-1 Q&D file under the tab “additional”
Price Earnings Information • Where do you get price earnings levels? • Go to Bloomberg, type your index, i.e. spx [index] and go. • Then type “HE” for historical price earnings • Tab to the date Range and put in “96” for 10 years. • Determine your Fiscal Year End from your company reports • Copy the Index levels to your spreadsheet • Assuming a September year-end (see the green circles) Note: I have also included this information in the FR-CR-1 Q&D file under the tab “additional”
Getting your Historical Index Earnings • How do you get your historical index earnings? • Divide your historical index level by the historical price earnings ratio. • This is great for historical data. What about forecast data? • Your forecast price is simply today’s price. Your best estimate, assuming efficient markets, of tomorrow’s price is today’s price • For your index earnings, we will use other companies forecasts.
Forecast Index Earnings • Where do you get earnings estimates? • Go to Bloomberg, type your index, i.e. SPX [index] and go. • Then type “EE” for historical price earnings • Type “8” for Zacks. It is generally the only highlighted option • For purposes of this class, I recommend you use the “Mean” estimate for each of the fiscal years (see the green circle) • For additional years, multiply the latest index earnings times 1 plus the 5 year growth rate (see the red circle)
Earnings Estimates (continued) • How do I know who made the forecasts? • Go to page 3. It lists the companies (and analysts) by name (see green circles) • Does it give any additional information? • It also gives their changes from their last forecast (see red circle) • Is there any way to determine volatility in the earnings forecasts? • Yes, look for the standard deviation of forecasts. • Generally, you should be within two standard deviations of most forecasts. (see orange circles) • Anything beyond that would be cause for concern
C. Know how to calculate earnings for companies with non-December year-ends • What about if you have a non-December fiscal year end? What do you do? • 1. Determine your index earnings for your December year end • 2. Assume that earnings for the index are consistent throughout the year, i.e., earnings are equally earned each month • 3. Calculate your earnings by taking part of this years earnings and part of last year’s earnings • For example, if you have a June year-end, your index earnings for June of this year would be 6/12 (50%) of index earnings for this year and 6/12 (50%) for last year
Review of Objectives • A. Do you know the importance of index earnings in company valuation? • B. Do you know how to copy data to your spreadsheet? • C. Do you know how to calculate index earnings for companies with non-December year -ends?