Download
1 / 1
10 likes | 127 Vues
0.2 m. 0.5 m. 2 m. 1.5 m. 2.5 m. 3 m. 2.5 m. 3 m. 5 m. 10 m. 16 m. 24 m. 32 m. 40 m. NUS07-5. NUS07-7. NUS07-2. 55 m. Measured monthly means, Jan. - Nov., 2008. -0.51 ºC. -0.62 ºC. -0.72 ºC. 70 m. -1.21 ºC. -1.31 ºC. -1.31 ºC. No trend. -0.77 ºC. -0.87 ºC.

E N D
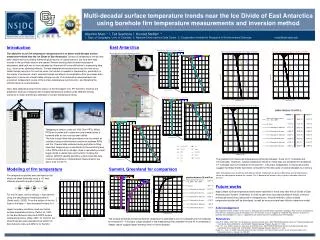
0.2 m 0.5 m 2 m 1.5 m 2.5 m 3 m 2.5 m 3 m 5 m 10 m 16 m 24 m 32 m 40 m NUS07-5 NUS07-7 NUS07-2 55 m Measured monthly means, Jan. - Nov., 2008 -0.51 ºC -0.62 ºC -0.72 ºC 70 m -1.21 ºC -1.31 ºC -1.31 ºC No trend -0.77 ºC -0.87 ºC -0.87 ºC 0.1 ºC/decade for 100 years 90 m -0.80 ºC -0.90 ºC -0.89 ºC 0.1 ºC/decade for 50 years -0.33 ºC -0.43 ºC -0.43 ºC 0.2 ºC/decade for 100 years -0.39 ºC -0.49 ºC -0.47 ºC 0.2 ºC/decade for 50 years 0.10 ºC 0.0 ºC 0.01 ºC 0.3 ºC/decade for 100 years 0.02 ºC -0.08 ºC -0.05 ºC 0.3 ºC/decade for 50 years January, 2008 July February August March September April October May November June Measured monthly means, Dec.,2007 - Nov., 2008 0.87 ºC -0.11 ºC No trend 0.37 ºC 0.1 ºC/decade for 100 years 0.33 ºC 0.1 ºC/decade for 50 years 0.85 ºC 0.2 ºC/decade for 100 years 0.78 ºC 0.2 ºC/decade for 50 years 1.33 ºC 0.3 ºC/decade for 100 years 1.23 ºC 0.3 ºC/decade for 50 years [AGU Fall Meeting, December 18, 2008] Multi-decadal surface temperature trends near the Ice Divide of East Antarctica using borehole firn temperature measurements and inversion method Atsuhiro Muto 1, 2, Ted Scambos 2, Konrad Steffen1, 3 1. Dept. of Geography, Univ. of Colorado 2. National Snow and Ice Data Center 3. Cooperative Institute for Research in Environmental Sciences muto@colorado.edu East Antarctica Introduction Monthly mean temperature profiles at NUS07-2 Measured and modeled temperature profiles at NUS07-2 Measured and modeled temperature profiles at NUS07-2 The objective of our firn temperature measurements is to detect multi-decadal surface temperature trends near the Ice Divide of East Antarctica. Surface air temperature trends have been determined using mainly meteorological records of coastal stations, but long-term data records in the ice sheet interiors are sparse. Remote sensing data (infrared and passive microwave) date back two to three decades but there are still some difficulties in interpreting data (e.g., cloud cover, scattering effects). Surface temperature reconstructions can be done using stable isotope records in firn and ice cores, but caution is needed in interpretation, particularly in the interior of Antarctica, due to seasonal biases and effects of precipitation. Also, processes after deposition of snow can disrupt stable isotope records. Firn temperature measurements can provide an independent source of the surface temperature reconstruction, and therefore the climate trends of recent decades. Here, data obtained during the first season of the Norwegian-U.S. IPY Scientific Traverse are presented. Data are compared with modeled temperature profiles under different climatic scenarios to obtain preliminary estimates of surface temperature trends. Map created by Stein Tronstad, Norwegian Polar Institute. depth (m) depth (m) depth (m) temperature (ºC) Monthly mean temperature profiles at NUS07-5 temperature (ºC) temperature (ºC) Measured and modeled temperature profiles at NUS07-7 gradient between 16 and 90 m depth (m) Monthly mean temperature profiles at NUS07-7 Temperature sensors used are 1000 Ohm PRTs. Wired PRTs are bundled with a steel wire and lowered down a borehole after an ice core has been drilled. The hole is back-filled with granulated snow to prevent air circulation and provide thermal conduction between PRTs and firn. Thermal data collected during and after re-filling show that temperatures re-equilibrate to the sensitivity level of the PRTs within 30 to 50 days. Data is recorded by a data logger inside a sealed case and buried 2 m below the surface. ARGOS satellite telemetry system transmits data. Overall uncertainties of temperature measurements are about 0.02 to 0.03 ºC. depth (m) temperature (ºC) depth (m) temperature (ºC) The gradient from measured temperature profiles lies between those of 0.1ºC/decade and 0.2ºC/decade. Therefore, surface temperature trends for three sites are estimated to be between 0.1ºC/decade and 0.2ºC/decade for the past 50 – 100 years. Straightness in measured profiles suggest that these trends have been consistent for the time scale of several decades to a century. Note: Simulations were carried out with different trends, ending with the present-day mean annual temperatures hence the convergence towards the surface. This is because the Vostok history is given in deviations from the present. temperature (ºC) Modeling of firn temperature Summit, Greenland for comparison Firn temperature profiles were modeled for the whole ice sheet thickness using a 1-D heat diffusion-advection equation which is, Monthly mean temperature profiles at Summit Measured and modeled temperature profiles at Summit gradient between 16 and 90 m NUS07-05 modeled temperature profile Summit modeled temperature profile Future works Approximate surface temperature trends were obtained for three sites near the Ice Divide of East Antarctica and Summit, Greenland. In order to gain more accurate estimate of trends, inversion will be performed using measured firn temperatures. Inverse method to utilize multiple temperature profiles will be developed, as well as more accurate heat diffusion-advection model. depth (m) depth (m) For the firn layer, vertical velocity w was derived using the densification model presented in Zwally and Li (2002). From the bottom of the firn layer to the base, w was decreased linearly to 0. Upper boundary conditions used are Vostok surface temperature history (Petit et al., 2001) for the East Antarctic sites and GISP2 surface temperature history (Alley, 2001) for Summit. Ice sheet thickness was assumed to be 3000m for East Antarctic sites and 3050 m for Summit. depth (m) Acknowledgement temperature (ºC) We would like to thank members of the traverse, Norwegian Antarctic Research Expedition, Norwegian Polar Institute, and Raytheon Polar Services Company during the Norwegian-U.S. IPY Scientific Traverse. Support by CH2M Hill Polar Services at Summit is gratefully acknowledged. This work is supported by US National Science Foundation grant OPP-0538103. temperature (ºC) The surface temperature trend at Summit, Greenland is estimated to be 0.2ºC/decade and 0.3ºC/decade for the past 50 – 100 years. Larger gradient in the measured profiles between 16 and 40 m compared to deeper region suggest larger warming trend in recent decades. References temperature (ºC) Alley, R.B. (2004): GISP2 Ice Core Temperature and Accumulation Data. IGBP PAGES/World Data Center for Paleoclimatology Data Contribution Series #2004-013. NOAA/NGDC Paleoclimatology Program, Boulder CO, USA. Petit, J.R., et al. (2001): Vostok Ice Core Data for 420,000 Years, IGBP PAGES/World Data Center for Paleoclimatology Data Contribution Series #2001-076. NOAA/NGDC Paleoclimatology Program, Boulder CO, USA. Zwally, H. J. and J. Li (2002): Seasonal and interannual variations of firn densification and ice-sheet surface elevation at the Greenland summit. J. Glaciol., 48, 199-207.