Download
1 / 47
470 likes | 490 Vues
Explore the vulnerability of the Albert Nile Ecosystem to natural hazards like drought and floods due to climate change. The study assesses exposure, sensitivity, and adaptive capacity, providing practical recommendations for disaster risk reduction and climate change adaptation.

E N D
Albert Nile EcosystemClimate Change Vulnerability and Capacity Assessment Joseph Okecho Olwenyi MENR; MGE
Outline • Emerging Issue • Method • Data • Results • Recommendations and conclusions
Emerging issue – Why the VCA is important • The challenge to assess natural hazards vulnerability at district level within the Albert Nile Ecosystem • The need to measure vulnerability to natural hazards • The need to identify opportunities for disaster risk reduction and climate change adaptation. • To develop practical measures and policy recommendations for reducing the climate change impacts and its associated vulnerabilities.
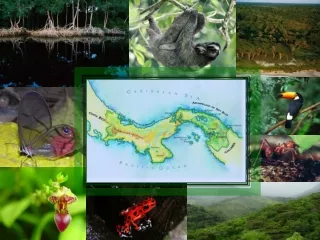
Study area-Albert Nile Ecosystem • Albert Nile, also called Mobutu Nile, the upper Nile River in northwestern Uganda. • The Albert Nile issues from the north end of Lake Albert, just north of the mouth of the Victoria Nile. It flows 130 miles (210 km) north past Pakwach to the South Sudanese border at Nimule, where it becomes the Al-Jabal River, or Mountain Nile. It is navigable throughout its course.
Methodological approach • Vulnerability to climate change varies with the unique characteristics of that system including its • exposure, • sensitivity, and • adaptive capacity. • The key determinants of impact are • exposure to hazard, • sensitivity of the natural environment to the exposure (biophysical vulnerability), and • sensitivity of the human environment to the exposure (social vulnerability).
Methodological approach • Social vulnerability: Determinants of social vulnerability in the three districts include; social aspect (gender imbalance, lack of social networks, owner and access on productive asset such as land, migration), literacy level, income levels, and conflicts over resources. • Biophysical vulnerability: Vulnerability to climate related induced drought and flood vary in space and time in the three districts.
Methodological approach • Exposure to a hazard is a precondition for an impact. • Translation of exposure into hazard is dependent on the nature of vulnerability. • Sensitive natural environment coupled with poor preparedness of the population and poor social institutions to facilitate coping may result in high impact hazards. • The same exposure may result in less or no impact if social vulnerability is lower due to appropriate coping capacity.
Methodological approach • Based on this understanding, the study assessed the determinants of vulnerability to establish an understanding of the baseline conditions of the ANE: • Climate trends and projections for the ANE; • Identification of what is at risk: exposure of individuals, communities, assets and resources to water-related hazards; and the degree of risk due to exposure to hazards; and • Impacts of the hazards on people and their assets
Methods for data collection • The focus was on key climate change hazards namely; floods and drought. • Both qualitative and quantitative assessments were employed in collecting information; analysis and presentation to assess the vulnerability of climate change risks, impacts and coping capacities in the Albertine ecosystem. • Quantitative data were collected through a structured household survey, semi-structured in-depth interviews. Qualitative data were obtained during focus group discussions. Modeling methods were used. • Emphasis was placed on gaining a multi-dimensional view of livelihoods which allows for the identification of the most vulnerable households and placing people’s priorities for improving their livelihoods and responding to the changes.
Modelling-Standard Precipitation Index • Areas experiencing vulnerable water stress (drought and flood). • The level of exposure to climate stress and their extent. • SPI was estimated from rainfall data obtained from Meteorology Department and awhere website and covered north-eastern DRC and the southern part of south-Sudan. • The extent of climate related water stress was determined by interpolation in a ArcGIS 10.1 version. • Climate projection for mid and end century was done in R software with a script developed by Alex Ruane from the NASA. This was done for Arua, Nwoya and Moyo. Only maximum and minimum temperature and rainfall were projected for RPC 4.5 and 8.5 for mid and end century.
Modelling… • In addition, flood prone areas were determine using HEC-GeoRAS software integrated into ArcGIS environment. A mixture of both traditional and automated flood delineation procedures were adopted to assess the extent and vulnerability of the communities to the effects of floods.
(4) Findings or results of the VCA (A) Exposure -Drought vulnerability modelling assessment results • Generally the whole area is relatively dry during the month of January to March.
Findings continued….. • April-May-June period: During the month of April, May and June a gradient of rainfall appears from the north western region towards the south eastern part of the region. The rest of the region is in extremely dry conditions.
Findings continued….. • July-August-September period: Similar pattern of the period April, May and June is experienced in July, August and September.
Findings continued….. • October-November-December period: In October, November and December, Koboko, Yumbe and Maracha are moderately dry. The rest of the region follows the January-March pattern.
Findings continued….. • (B) Floods vulnerability modelling assessment results The results from flood vulnerability assessment show that districts which fall within the River Nile basin/ depression (low lands) were more prone to flooding and flash floods unlike the terrestrial flooding areas.
Findings or results Projected climate change scenarios All the models are projecting an increment in both minimum and maximum temperatures, and rainfall for all the models for mid and end century. • Within the mid and end of century time periods Temperature: • Increase in minimum (Mid 1.7- End 1.99oC ); • Increase in maximum temperatures (Mid 1.49- End 1.83oC); Precipitation: • An increase in precipitation levels (4.5-14 %) with the exception of Yumbe district which are all likely to exacerbate climate change effects
Findings.. • (A) Community exposure to hazards Severity of the hazards (level of exposure): • Drought was the most severe hazard being experienced (92.7%) followed by heavy rains (63.4%), bush fires (36.8%) and diseases (36.2%). • The flooding problem in Yumbe district is associated with the low-lying areas located along the banks of river Nile and its corresponding water streams
Findings…. Frequency of hazards • Hazards Heavy rains Bushfire Drought Hailstones • Frequency(Times) <3 3-6 >6 <3 3-6 >6 <3 3-6 >6 <3 3-6 >6 • Yumbe (%) 68 24 8 89 11 0 70 28 2 93 7 0 • Moyo (%) 65 33 1 97 3 0 75 22 3 82 14 5 • Nwoya (%) 57 39 4 82 17 1 81 18 2 75 25 0
Findings… Frequency of the hazards (Heavy rain, bush fire, drought, Hail stones) • Most of the key hazards had occurred less than three (03) times per year • Rainfall had significantly decreased in rainfall compared to 1980s and 1990s in Moyo (77%) and Nwoya (77%) and Yumbe (49%) • Consistent with the findings of the quantitative survey, the informants and focus group discussants reported that major climate hazards in the study districts were drought, heavy rains, bush fires and Hail stones.
Findings… (1) DROUGHT Comparison of rainfall received this year and in the past 10-20 years: • Rainfall had significantly decreased compared to 1980s and 1990s in Moyo (77%) and Nwoya (77%) and Yumbe (49%) districts (p < 0.001); • Drought in the three districts is always manifested as decreased rainfall and increased dryness (meteorological stress). • Water stress is the most challenging hazard in terms of frequency of occurrence and impacts on the well being and livelihood of the communities.
Findings • Sources of water for domestic consumption: • Present water sources for domestic consumption had significantly increased in the study districts (p<0.001). Attributed to increased provision of borehole water and extension of piped water in few areas within the study districts especially in Nwoya and Moyo. • Despite this, majority of the respondents consumed water in its unsafe state in Nwoya (91%), Moyo (81%) and Yumbe (81%) respectively • Only 21% of the respondents in all study areas boiled their water before consuming it while only 18% filtered water and 10% added chlorine to the water before; majority consumed un boiled water. • Sources of water for Livestock rearing: • More respondents reported a decrease in present water sources for livestock compared to the past 10-20 years with the highest number of respondents indicating a decrease in Moyo (41%) and Yumbe (25%); • Reasons given for the reduced water sources for livestock were unpredictable rainfall patterns, reduction of water in streams due to drought. Similarly water quality for livestock had reduced in all districts. • Sources of water for crop production: • Compared to the last 10 to 20 years, the present sources of water for crop production had generally decreased. Respondents from Moyo district registered a relatively high percentage (63%) among those who indicated a significant decrease in water sources, followed by Nwoya (54%) and then Yumbe (36%) • Reasons for the reduction in water sources for crop production were due to unreliable rainfall patterns and longer dry spells than usual.
Results • (2) HEAVY RAINS CAUSING FLOODS • Comparison of damaging floods received this year (2013) and in the past 10-20 years: • Despite the fact that the GIS floods vulnerability assessment indicated the occurrence of flash floods in Nwoya District (1593.7 Sq.km) followed by Moyo (885.2 Sq.km) and lastly Yumbe District with (378.7 Sq.km) respectively; • Respondents reported that the occurrence of damaging floods had significantly decreased compared to 1980s and 1990s in the districts of Nwoya (33%), Mwoyo (31%) and Yumbe (16%). • The significant decrease in damaging floods may be attributed to the decline in rainfall quantities received in some areas. Also some community members have their homesteads situated far from water streams making them less vulnerable to damaging floods. According to the FGD in Nwoya district, many community members affirmed to the fact that their shelters are raised far from water streams and are on raised grounds and have never experienced flooding.
Results SENSITIVITY: Impact of climate hazards • Impacts of climate change are resulting in diminished livelihood opportunities and options. Individual productive assets such as livestock, crops, housing structures, and gardens or farming lands are lost due to a combination of hazards including drought, floods, and climate-sensitive diseases. • Impact of climate change on livelihoods Respondents believe that their livelihoods have significantly been affected (negatively) by climate change in Yumbe (51%) and Nwoya (52%). On the other hand, in Moyo district (37%) of respondents reported an improvement on their livelihoods in due to climate change in the last 20 years. • Reasons reported for deteriorating livelihood in Yumbe and Nwoya were crop failure, hunger, climate related diseases and dry spells causing low crop production.
SENSITIVITY: Impact of climate hazards • Perceived perceptions on impact of climate change on natural resource • Impacts on wetlands: Generally the majority of the respondents reported that wetlands have deteriorated due to changing climate in Moyo (61%), Nwoya (60%) and Yumbe (49%). Focus group discussants reported that many swamps have dried up due to long dry spells. • It was also noted that swamp cultivation, livestock rearing, brick making and sand mining had hastened the effects caused by long dry spells on swamps.
SENSITIVITY: Impact of climate hazards • Impact on forests/trees: Majority of the respondents reported deterioration in forests/tree status in Moyo (64%), Nwoya (58%) and Yumbe (39%) respectively. • Focus group discussants attributed deforestation to massive tree loss which has become a source of livelihood due to food shortages especially during drought. Also wild bush fires are believed to causing tree destruction. • They also reported that high temperatures and the long dry spells have almost made it impossible for tree seedlings to grow.
SENSITIVITY: Impact of climate hazards • Impact on firewood sources: Majority of the respondents reported deterioration in firewood sources in the in Nwoya (64%), Moyo (32%) and Yumbe (30%) • Impact on food security: Yumbe and Moyo were the only districts where the majority of respondents (66% and 49%) respectively did not produce enough food to feed their families; while majority of people that produce enough food to feed their families were in Nwoya (70%). Of those who produce food for their families (100%) of their land is rain fed while none was irrigated land.
SENSITIVITY: Impact of climate hazards • Perceived status of soil fertility: • Soil fertility, as shown in table 12 was perceived to be declining in Nwoya (70%), Moyo (70%) and Yumbe (59%) respectively and the major causes were perceived to be; over cultivation in Yumbe (84%), Moyo (77%) and Nwoya (71%). Therefore food shortages are likely to be hastened by declining soil fertility which will increase food insecurity; hence there is need for wider community based education on better farming practices so as to reduce people’s vulnerability related to food shortages
SENSITIVITY: Impact of climate hazards Impact of climate change on human diseases: • There seems to be an increase in impact of climate change on human diseases during drought compared to the last 10 – 20 years. • Yumbe district registered a very big impact with the highest number of respondents in this category (68%) followed by Nwoya (49%). Moyo district registered the highest moderate impact of climate change on human diseases during drought (58%). • Likewise, most respondents reported increased impact of climate change on human diseases during heavy rains in the last 10 – 20 years.
SENSITIVITY: Impact of climate hazards • Malaria was considered to be affecting most households in all study districts with the highest number (88%) of respondents in Nwoya followed by Moyo (77%) and Yumbe (76%). • Dysentry and Filaria occurrences were reported by 2% and 1% of respondents respectively, in Yumbe district. • Also Moyo and Yumbe had the highest cases of typhoid and diarrhea which may be attributed to a reduction in domestic water quality in both districts in Yumbe and Nwoya
SENSITIVITY: Impact of climate hazards Impact of climate change on livestock diseases and pests: • Higher diseases during drought across districts than it is during heavy rain storms. Eighty one percent (81%) of the respondents in Yumbe district and 58% in Nwoya indicated that animal (livestock) diseases had increased in the past 10-20 years compared to 1980s during periods of drought. Impact of climate change on livestock rearing: • Most respondents reported inadequate pastures was the major challenge experienced due to changing climate especially in the dry seasons; followed by inadequate water for livestock as well as diseases and pests such as ticks. Impact of climate change on plant pests and diseases: • Most of the respondents reported increased incidences of plant pests and diseases during drought than rain seasons. E.g. cassava rosette, mosaic, cassava brown steak disease and bacterial blight
SENSITIVITY: Impact of climate hazards Impact of climate change on access to water by gender categories: • Impacts of climate change affect access to water by gender categories differently. • Impacts of climate change manifesting as drying of rivers, springs and boreholes means that household members have to move longer distances to look for water. • Majority of the respondents reported that their women collected water during rainy seasons from sources in Yumbe (83%), Nwoya (69%), Moyo (72%) and Nwoya (69%) followed by female children in Nwoya (8%), Moyo (8%) and Yumbe (5%); • Husbands and male children did less of collecting water from water sources
(C) ADAPTIVE CAPACITY Current livelihood and income diversity of households: • Major livelihood source for most households was crop production for subsistence purposes and was practiced mostly by women and female children; some households practiced bee farming in Yumbe and Moyo with community confirming that men’s involvement was higher than female • Alternative and supplementary livelihoods: charcoal burning, commercial forestry, sand mining, bee farming, trade, fishing, poaching among others; • Also all of these livelihoods were not sustainable rendering them unable to cope with and recover from natural or manmade stresses and shocks
ADAPTIVE CAPACITY • Awareness of household vulnerability to climate hazards: • Drought had the highest vulnerability rating (or highest level of awareness), followed by disease outbreak and unpredictable rainfall patterns. • Results were confirmed by the drought vulnerability analysis using SPI-standard precipitation index which reported that drought had been experienced for most months of the year for over 10 years in most parts of the region
ADAPTIVE CAPACITY • Access climate related information: • The majority of respondents reported that they had never received information on weather forecasts in Yumbe (59%) and equally in Moyo (54%) and Nwoya (55%). • Dissemination of weather forecasts: The majority of the respondents reported that they had received weather forecasts once in a year in Yoyo (41.4%), Yumbe (40.9%) and Nwoya (29.2%) followed by weekly updates in Nwoya (27.8%), Moyo (27.6%), and Yumbe (19.7%). Those who reported receiving daily updates were in Yumbe (31.8%), Nwoya (30.6%) and Moyo (5.2%). The least number of respondents reported receiving weather forecasts thrice a year majorly in Moyo (12.1%) and Nwoya (4.2%).
ADAPTIVE CAPACITY • Resources accessed for weather forecast: The highest number of respondents reported that they receive weather forecasts from radio in Moyo (88%), Yumbe (82%) and Nwoya (80%) and by Word of mouth in Yumbe (17%), Nwoya (10%) and Moyo (5%). • Uses of weather forecasts (disseminated information): The majority of respondents used the information on weather forecast to; prepare land for crops in Nwoya (65%), Yumbe (60%) and Moyo (55%) while others used the information for planting in Moyo (44%), Yumbe (33%) and Nwoya (40%)
ADAPTIVE CAPACITY Reliability of weather forecasts: • Lastly majority of the respondents affirmed to the fact that weather forecasts were rarely reliable in Moyo (78%), Yumbe (75%) and Nwoya (51%) followed by never reliable in Nwoya (41%), Moyo (17%) and Yumbe (16%). • Very few respondents reported that information received was usually reliable in Yumbe (9%), Nwoya (6%) and Moyo (5%) • Information to help deal with water stress problems: Majority of the respondents reported that they did not receive information to help them deal with water problems especially in Nwoya (71%), Moyo (64%) and Yumbe (56%) respectively. This makes them un able to cope with water challenges due to climate change water stress related impacts
ADAPTIVE CAPACITY • Type of information received on water stress: Majority of the information received on water related challenges were on, early warning as well as coping and recovering from drought Access to produce and livestock market related information: • Respondents who accessed market information: The majority of respondents reported that they had never received market information on produce and livestock in Yumbe (65%), Nwoya (63%) and Moyo (51%) respectively. The highest number that received market information was in Moyo (51%), Nwoya (37%) and Yumbe (35%)
ADAPTIVE CAPACITY • Resources accessed for market information: The highest number of respondents reported that they receive market information on weather from radio in Nwoya (81%), Moyo (67%) and Yumbe (61%) respectively and by Word of mouth in Yumbe (32%), Moyo (21%) and Nwoya (14%). • Perception on usefulness of information on markets: Majority of the respondents perceived market information • Formal and informal networks supporting climate hazards reduction and adaptation: Majority of the respondents were affiliated to formal and informal groups within their communities in Moyo (73%), Yumbe (52%) and Nwoya (61%)
ADAPTIVE CAPACITY • Ability of the community to organize and act together when faced with climate change events in Yumbe district • majority of the respondents disagreed that their villages had plans to deal with climate related events such as drought, floods and diseases (84%); they were able to coordinate to quickly respond to effects of climate events (64%); had institutions to help to cope with the effects of climate events such as floods and drought (70%); their members worked together to overcome impacts of climate events (70%); their villages were able to access external support (from districts and other) when needed (65%);
ADAPTIVE CAPACITY Current coping and adaptation responses used by households: • Most coping measures whenever respondents were faced with shortage of water included; limit water consumption per person as indicated by (63%) in Yumbe, (64%) in Moyo and Nwoya districts. Twenty percent (20%) in Yumbe and 29% in Nwoya move to other places in search for water while 22% of respondents in Moyo change crop types • The most adopted adaptation measures whenever respondents were faced with food shortages due to climate changes included; growing drought resistant food crops; in Yumbe (89%), 65% in Moyo as well as 49% in Nwoya; growing disease resistant food crops, use of farm inputs and, soil and water conservation practices
ADAPTIVE CAPACITY Adaptation practices used to overcome climate change impacts • Boreholes have been used as a major source of water to adapt to water shortages during drought in Yumbe (68%), Nwoya (65%) and Moyo (34%) respectively; followed by rivers/streams in Moyo (24%), Yumbe (16%) and Nwoya (2%) and Piped water in Moyo (25%), Nwoya (11%) and Yumbe (2%)
Conclusions The result shows that the study area is vulnerable to climate hazards. • Study has predicted within the mid and end century periods an increase in minimum (1.7-1.99oC) and maximum (1.49-1.83oC) temperatures in the study districts as well as a decline in precipitation levels (4.5-14 (%)) with the exception of Yumbe district due to its orientation towards the rain forests in DRC • Vulnerability to climate related induced drought and flood vary in space and time in the three districts. However, Nwoya is faced with relatively high drought and is flood prone compared Yumbe and Moyo. Adaptive capacities are relatively low. • This result is very relevant other districts in the AE because we shall need to assess vulnerability to climate hazards, which includes most of the observed agro climatic hazards, for a territory of which 60% is agriculture land. It is well known that the level of vulnerability depends on land use practices in a given territory, but it is important also to pay attention on the interrelationship between the type of hazard and the share of the territory exposed and sensitive to the impact of a particular hazard, heaving in mind it’s intensity and frequency.
Conclusions • Local governments are faced with the need to implement successful risk management: and it is very much a matter of the management of the districts’ territory. The digital maps of hazard, exposure and sensitivity provide not only useful information for different management purposes but also make possible implementation of GIS modeling and testing of the expected results from one or another decision. • In addition to this, the method may be applied to different hazards or hazard groups and provide base for comparison of the vulnerability between them.
Conclusions • The proposed method for vulnerability assessment provides reliable answers to a set of questions like: What are the dangerous phenomena that occur? How dangerous they are? Which systems are most exposed to one or a group of hazards and to what extend? How sensitive are the systems to this impact? What is capacity of the districts to deal with the threats or to prevent them?