Review Power point for DCA 18
120 likes | 246 Vues
This educational resource provides a comprehensive, hands-on approach to understanding potential and kinetic energy through engaging station activities. Students will categorize energy types using Venn diagrams, diagram javelin paths, and solve griddable questions based on graphs. They’ll explore the concepts of energy dynamics as they simulate real-life scenarios such as throwing straw javelins and graphing a walk/run story. This interactive method enhances comprehension of energy forms and motion, making learning both effective and enjoyable.

Review Power point for DCA 18
E N D
Presentation Transcript
Station 1 Potential/Kinetic Energy Match Up • Place the cut outs into the correct category in the Venn diagram. If the cut out represents both potential and kinetic, place it in the middle where both share the same space. • Draw or write the words for what you place in each category on your review sheet.
Station 2Starboard • Click and Drag • Label Graph
Station 3Javelin ThrowPotential and Kinetic Energy • Students will use straws as javelins. • Students will throw their straw from a marked point. • Students then diagram the path of the “javelin” • Students will label the diagram indicating where potential energy is DECREASING and where it is at it’s HIGHEST and LOWEST points. • Students will label the diagram indicating where kinetic energy INCREASING and where it is at it’s HIGHEST and LOWEST points. • What forces are influencing the path of the “javelin”?
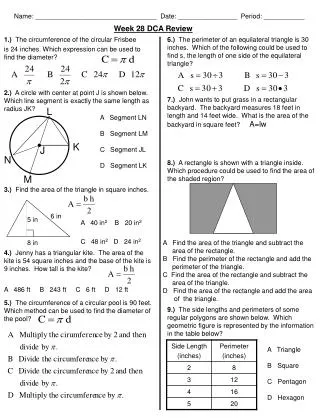
Station 4 Griddable • Using the above graph answer the following questions. Answer the questions using the griddable on your answer sheet. • What is the distance at point C? • How many meters did they travel form point G to point H? • How long were they at rest?
Station 5 Graph a Story Using the graph on your answer sheet draw a graph for the following story: A person who walks two blocks at a moderate speed, waits at an intersection for a short time until the “walk” light turns “green”, then walks the next block more slowly, and finally runs the final two blocks very rapidly. *Watch your x-axis on this graph!
Station 6String Graph • 1. Pick one of the four graph cards. • 2. Using the string provided duplicate the graph that you have chosen. • Using the labels, label your graph. • Draw your graph with labels in the box provided on your answer sheet.
Station 7 Potential/Kinetic Energy Match Up • Place the cut outs into the correct category in the Venn diagram. If the cut out represents both potential and kinetic, place it in the middle where both share the same space. • Draw or write the words for what you place in each category on your review sheet.
Station 8Javelin ThrowPotential and Kinetic Energy • Students will use straws as javelins. • Students will throw their straw from a marked point • Students then diagram the path of the “javelin” • Students will label the diagram indicating where potential energy is DECREASING and where it is at it’s HIGHEST and LOWEST points. • Students will label the diagram indicating where kinetic energy INCREASING and where it is at it’s HIGHEST and LOWEST points.
Station 9 Griddable • Using the above graph answer the following questions. Answer the questions using the griddable on your answer sheet. • What is the distance at point C? • How many meters did they travel form point G to point H? • How long were they at rest?
Station 10 Graph a Story Using the graph on your answer sheet draw a graph for the following story: A person who walks two blocks at a moderate speed, waits at an intersection for a short time until the “walk” light turns “green”, then walks the next block more slowly, and finally runs the final two blocks very rapidly. *Watch your x-axis on this graph!
Station 11String Graph • 1. Pick one of the four graph cards. • 2. Using the string provided duplicate the graph that you have chosen. • Using the labels, label your graph. • Draw your graph with labels in the box provided on your answer sheet.