Download
1 / 1
10 likes | 110 Vues
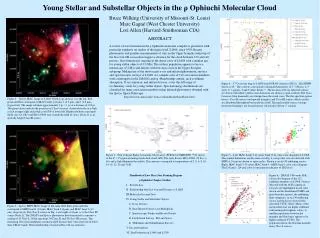
This review presents a comprehensive analysis of star formation in the ρ Ophiuchi molecular complex, focusing on the main cloud, L1688, since 1991. Ongoing star formation in L1688's dense cores is explored, highlighting a median age of 0.3 Myr for young stellar objects. Recent photometric and parallax measurements suggest a distance of 120-140 parsecs for the cloud. The study compiles a list of 312 association members with counterparts in the 2MASS catalog, utilizing various criteria to classify their evolutionary states. X-ray and infrared surveys are utilized to provide insights into the spectral energy distributions of these young stellar objects. Figures detailing molecular gas, dust, and stellar populations are included to enhance understanding of star formation in this region.

E N D
Young Stellar and Substellar Objects in the ρ Ophiuchi Molecular CloudBruce Wilking (University of Missouri-St. Louis)Marc Gagné (West Chester University)Lori Allen (Harvard-Smithsonian CfA)ABSTRACT A review of star formation in the ρOphiuchi molecular complex is presented, with particular emphasis on studies of the main cloud, L1688, since 1991. Recent photometric and parallax measurements of stars in the Upper Scorpius subgroup of the Sco-Cen OB association suggest a distance for the cloud between 120 and 140 parsecs. Star formation is ongoing in the dense cores of L1688 with a median age for young stellar objects of 0.3 Myr. The surface population appears to have a median age of 2 Myr and merges with low mass stars in the Upper Scorpius subgroup. Making use of the most recent x-ray and infrared photometric surveys and spectroscopic surveys of L1688, we compile a list of 312 association members with counterparts in the 2MASS catalog. Membership criteria, such as lithium absorption, X-ray emission, and infrared excess, cover the full range of evolutionary states for young stellar objects. Spectral energy distributions are classified for many association members using infrared photometry obtained with the Spitzer Space Telescope.http://newton.umsl.edu/~brucew/handbook/handbook.html Figure 4 – C18O contour map of L1688 from FCRAO courtesy of Di Li. The HPBW shown is 46". The contours correspond to integrated intensities of 2, 3 (black), 4, 5 (red), 6, 7 (green), 8 and 9 (blue) K km s-1. The location of X-ray detected sources are shown with filled symbols, non-detections are shown as open symbols. The Class I sources (blue diamonds) are clumped near the cloud cores. The flat-spectrum (green boxes), Class II sources (red upward triangles) and Class III sources (black circles) are distributed throughout but inside the cloud. The unclassified sources (orange downward triangles) are located mostly outside the 2 K km s-1 contour. Figure 1 – Spitzer IRAC image of L1688. North is up and east is to the left. Red, green and blue correspond to IRAC bands 4 (8 μm), 2 (4.5 μm), and 1 (3.6 μm), respectively. The image subtends approximately 1 pc × 1 pc at a distance of 135 pc. The green circles indicate the positions of Class I sources, clustered mostly in ρ Oph core A at upper right and ρ Oph cores E/F at lower left. Bright nebulosity surrounds the B stars S1, SR 3 and HD 147889 (just outside the field of view). DoAr 21 is an optically bright Class III source. Figure 3 – Five Colleges Radio Astronomy Observatory (FCRAO) COMPLETE 13CO survey of the 6º × 3º region including Lynds dark cloud 1688. The early B stars HD 147889, 22 Sco, οSco and ρOph illuminate the nebula. The contours correspond to temperatures of 2, 4, 6, 8, 10, 14, 18, 22, 26 and 30 K. Figure 5 – Left: IRAC band [1-2] versus band [3-4] color-color diagram for L1688. The symbol definitions are the same as in Fig. 4, except that stars not detected with MIPS at 24 μm are shown as open circles. Shown is an AV=30 reddening vector. Right: IRAC band [1-3] versus IRAC band 4 - MIPS band 1 color-color diagram. The [3.6 μm] - [24 μm] color is our primary indicator of SED class. Figure 6 – 2MASS J-H versus H-Ks color-color diagram of the 312 candidate members of L1688. Sources detected with the ACIS camera on Chandra are highlighted in red. Also shown are the dereddened ZAMS and giant branches (green), the reddening lines (magenta), an AV=30 reddening vector, and the locus of previously classified CTTSs (blue). Many of the unclassified stars are highly reddened with normal photospheric colors. A smaller population (between the magenta and blue lines) appear to be highly reddened CTTSs. The population below the blue line includes many Class I sources. • Handbook of Low Mass Star Forming Regions • Ophiuchi Chapter Outline • Introduction • Relationship with Sco-Cen and Distance to L1688 • Molecular Gas and Dust • Young Stellar and Substellar Objects • A. X-ray Surveys • B. Near-Infrared Surveys and Multiplicity • C. Spectroscopic Studies and Brown Dwarfs • D. Far-Infrared Surveys: ISO and Spitzer • E. Millimeter and Submillimeter Surveys • V. Jets and Outflows • VI. Star Formation in L1689 and L1709 Figure 2 – Spitzer MIPS-IRAC image of the same field. Red, green and blue correspond to MIPS band 1 (24 μm), IRAC band 4 (8 μm), and IRAC band 2 (4.5 μm), respectively. The Class I sources in Fig. 1 are bright at 24 μm, as is the Class III source DoAr 21. The 2MASS and Spitzer photometry have been used to construct a catalog of 15 Class I, 36 flat-spectrum, 94 Class II, and 38 Class III sources. The remaining 129 cloud candidates are unclassified because they were observed in fewer than 2 IRAC bands. Their membership is based on Hα or X-ray emission.