Download
1 / 68
680 likes | 866 Vues
Modelling Climate and Disturbance Effects on Net Ecosystem Productivity of Temperate and Boreal Forests. Robert F. Grant* and colleagues in the Fluxnet-Canada Research Network * Department of Renewable Resources University of Alberta Edmonton, AB Canada.

E N D
Modelling Climate and Disturbance Effects on Net Ecosystem Productivity of Temperate and Boreal Forests Robert F. Grant* and colleagues in the Fluxnet-Canada Research Network *Department of Renewable Resources University of Alberta Edmonton, AB Canada
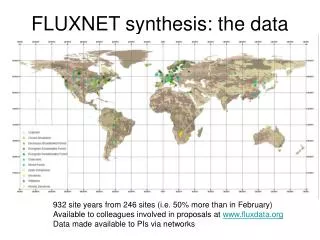
Fluxnet-Canada: Influence of Climate and Disturbance on Carbon Cycling in Forest and Peatland Ecosystems
Terrestrial Carbon Sink • It absorbs a significant amountof the anthropogenic carbon that is emitted to the atmosphere (e.g., 15 to 30%). • It is located in northern terrestrial ecosystems. • It has high inter-annual variability. • It provides a very valuable environmental service.
Canadian Forest Sector(forests and peatlands falling within Canada’s forest biomass inventory) Standing Biomass: ~ 15 Gt Soil and Peat: ~ 71 Gt Total ~ 86 Gt Canada’s carbon stocks are nearly 500 times greater than Canada’s anthropogenic emissions!! Canadian Anthropogenic C Emissions: ~ 0.18 Gt/yr
Canadian Forest Sector Photosynthesis: ~ 2.8 Gt C / yr Respiration and fires: ~ 2.8 Gt C / yr Natural flux is 15 times greater than anthropogenic C emissions!! Thus, ecosystem processes are a key part of the overall carbon problem.
Any attempt to understand and eventually manage Canada’s overall carbon emissions must address the effects of ….. Climate - temperature, precipitation, CO2Natural Disturbance - fire, pestsLand Use Activities - logging, fertilization, vegetation control
The general objectives of the network are:(1) To increase our understanding and our ability to model the effects of climate, natural disturbances, and forest management on terrestrial C cycling processes in the forests and peatlands of Canada.
(2) To contribute insights, ideas, and well-documented archived data sets to efforts aimed at understanding, constraining, and quantifying regional, national and global C cycles.
(3) Make a major contribution to understanding Canada’s role in the northern terrestrial carbon sink, specifically: (a) What is Canada’s contribution to the northern terrestrial sink?(b) How does it vary spatially and temporally?(c) What might influence it in the future?(d) What are the effects of land use management and natural disturbance?
(4) To train graduate students and postdoctoral researchers in terrestrial carbon cycle science.
These objectives will be attained by establishing, maintaining and reinforcing an east-west transect of carbon flux research stations across the commercial forest zone of Canada.
Eddy covariance flux towers will be used to measure ecosystem-level fluxes and these will be combined with studies of ecosystem components (e.g., soils, vegetation) so that we can understand the processes driving the tower fluxes.
Combustion losses CO2, CO, CH4 Decomposition Decomposition CWD, regeneration Renewed mature forest stand Successional vegetation to crown closure
What can models contribute? • Policy decisions require information about changes in GHG exchange between diverse terrestrial ecosystems and the atmosphere across at large temporal (years to centuries) and spatial (km2 to continental) scales • These changes are determined by complex interactions among weather, soils and disturbance, both natural (fire, pests) and human (tillage, planting, fertilizing, harvesting). • Research about how these changes are determined (e.g. FCRN) takes place in only a few ecosystems at much smaller temporal (seconds to seasons) and spatial (mm to km2) scales than those at which information is required • Modelling provides a way to use research conducted at smaller scales to derive policy-relevant information at larger scales
Some Recent Examples of Policy-Relevant Model Results • BIOME-BGC was used to estimate that average NEP and NBP of a 8.2 Mha forested region of Oregon was 168 and 100 g C m-2 y-1 (Law et al., 2004) • CBM-CFS2 was used to estimate that average NEP of a 97.6 Mha forested region in northern Canada rose from 53 g C m-2 y-1 in 1920–24 to 75 g C m-2 y-1 in 1960 and then declined to 26 g C m-2 y-1 in 1991-95 (Li et al., 2003). • CENTURY was used to estimate that average NEP of Chinese boreal forests would rise from 64 g C m-2 y-1 with a harvest cycle of 30 years to 102 g C m-2 y-1 with one of 100 years but decline to 88 g C m-2 y-1 with one of 200 years (Jiang et al., 2002) • BIOME-BGC was used to estimate NEP from 100 to 300 g C m-2 y-1 for 4 diverse coniferous forests in Europe, much of which was attributed to rising Ca and N depositions (Churkina et al., 2003).
Gases: O2, NH3, N2O, N2, CH4 Rn,LE,H water N2 C NH4+,NO3- heat gases water Mass and energy transfer scheme in ecosys dominant population subdominant population residue soil surface soil layer roots N,P
Example of Model Development: Modelling age effects on forest NEP • Disturbances such as clearcutting affect forest NEP for many decades afterwards. • Regional forest NEP therefore depends upon times since last major disturbance of all component stands. • The effects of logging on forest C exchange have to be assessed over long time periods. • Although chronosequence research can substitute space for time when assessing these effects, it also substitutes spatial for temporal variation. • Modelling can be used to assess forest age effects on NEP for use in regional estimates of NEP.
Model Hypotheses • (1) Early regrowth after disturbance is controlled by mineralization-immobilization of N by fine and woody residue. • (2) Later growth is constrained by declining hydraulic conductance and rising water potential gradients in taller trees. • (3) Later growth is also constrained by rising respiration requirements caused by accumulating phytomass
Surface litter Shoot Non-woody litter C:N ~ 40 Woody litter C:N ~ 40 DOC, DON DOC, DON DOC, DON DOC, DON NH4+ NO3- Microbes compete with roots for mineral N Microbial C:N ~ 8 Microbial C:N ~ 8 Microbial C:N ~ 8 Microbial C:N ~ 8 Humus C:N ~ 15 Micr. Residue C:N~8 Humus C:N ~ 15 Micr. Residue C:N~8 Humus C:N ~ 15 Micr. Residue C:N~8 Soil litter Woody litter C:N ~ 40 Non-woody litter C:N ~ 40 NH4+ Root NO3- Humus C:N ~ 15 Micr. Residue C:N~8 Hypothesis (1): model C and N transformations of fine and coarse woody litter that control N uptake during regeneration
Hypothesis (2): model axial conductance that affects yc at which root water uptake + capacitance = transpiration Rn LE H vapor pressureatm atmosphere stomatalsunlit,1 boundary stomatalshaded,1 canopy layer 1 vapor pressurecanopy stomatalsunlit,n canopy layer n c stomatalshaded,n axial1 axial2 capacitance s,1 axial3 r,1 soil1 radial1 s,2 radial2 r,2 soil2 s,n r,n radialn soiln soil layer 1 soil layer 2 soil layer n
Test of model hypotheses • Mass and energy exchange were measured in 2002 over a post-clearcut chronosequence of coastal Douglas fir stands originating in 2000 (3rd year), 1989 (14th year) and 1949 (53rd year) by UBC FCRN site. • These data were used to test modelled mass and energy exchange during a 120-year run of ecosys, an ecosystem model developed at the U of A as part of FCRN, under soil, weather and land use conditions for the Douglas fir site.
Planted 2000 1949 Height (m) 0.3 3-8 30-35 CHRONOSEQUENCE OF 3 DOUGLAS-FIR STANDS VANCOUVER ISLAND 14-year-old Clearcut 54-year-old Photos from Andy Black
Site and soil characteristics of the Campbell River site. Site Characteristics Latitude : N 4952.137’ Longitude : W 12520.120’ Elevation: 300 m Mean annual precipitation: 1461 mm/y* Mean annual temperature: 8.3 C* Dominant vegetation: 53 year old Douglas-fir (Pseudotsuga menziesii) with 17% red cedar (Thuja plicata Donn) and 3% western hemlock (Tsuga heterophylla (Raf.) Sarg.) Understory vegetation: sparse, mainly consisting of various mosses, ferns and herbaceous/ woody species such as salal, dull oregon grape, vanilla-leaf deerfoot. Mean basal area (1998) 71 m2 ha-1 (overstory) Fertilization: 20 g N m-2 as urea in 1994. Soil Characteristics† Horizon L-H Ap/Ae Bf1 ---------------- Bf2/Bfc ---------------- C Depth to bottom (m)0.1 0.2 0.3 0.4 0.5 0.6 0.7 0.9 Bulk Density (Mg m-3) 0.1 0.90 1.18 1.57 1.50 1.42 1.42 1.58 Field Capacity (m3 m-3)0.241 0.203 0.203 0.203 0.203 0.203 0.203 0.203 Wilting Point (m3 m-3) 0.117 0.068 0.068 0.068 0.068 0.068 0.068 0.068 Ksat (mm h-1) 36 94 121 133 97 121 107 107 Sand (g kg-1) - 692 809 880 898 838 883 875 Silt (g kg-1) - 227 169 105 93 157 97 98 Clay (g kg-1) - 81 23 15 9 6 20 26 Coarse Fragments (m3 m-3) 0 0.267 0.267 0.353 0.35 0.353 0.356 0.356 pH 5.2 5.45 5.45 5.92 5.92 5.92 5.0 6.87 Organic C (g kg-1) 81 62.1 28.5 17.5 17.0 18.6 10.0 10.3 Total N (g Mg-1) 1620 640 640 560 560 560 250 200 Exch. P (g Mg-1) 16 15 15 11 11 11 17 20 †Keser and St. Pierre, 1973. Soils of Vancouver Island: A compendium. B.C. For Serv. Res. Note 56 – Hart soil
Model runs for coastal Douglas-fir forest • Ecosys was initialized with • soil and topographic properties • above- and below-ground residues corresponding to those left after logging. • Ecosys was then seeded with Douglas-fir and run for 65 years • under repeated 6-year sequences (1998 – 2003) of weather data recorded at the 1949 site. • After 70 years, a simulated logging was applied in mid-January • 0.1, 0.1 and 0.65 of foliar, non-foliar non-woody, and coarse woody above-ground phytomass respectively was removed. • The modelled site was then reseeded in mid-March with Douglas-fir and deciduous bush to simulate competing pioneer populations. • The reseeded site was then run for a further 200 years • under repeated 7-year sequences (1998 – 2004) of weather data recorded at the 2000, 1988 and 1949 sites.
How does CO2 and energy exchange respond to a warming event on Vancouver Island in July 2002?
Greater sensitivity of gc to high D in older forest Declines in CO2 influxes begin earlier in older forest Hydraulic limitations on gc of coastal Douglas fir during warming event on Vancouver Island in July 2002
shift from LE to H with increasing age Different sensitivities of gc to D with forest age affects energy exchange (measurements from FCRN) 2000 1989 1949
As forests age, nutrient constraints on CO2 fixation become less, but diurnal declines in CO2 influx begin earlier. Older forests change from a sink to a source of CO2 under high D Different sensitivities of gc to D with forest age also affects CO2 exchange (measurements from FCRN) 2000 1989 1949
Greater variability in daily NEP with weather in older forests
Then NEP declines gradually – hydraulic constraints NEP reaches maximum values between 30 and 50 years after clearcut NEP < 0 during first 15 years– nutrient constraints NEP rises rapidly from 10 to 30 years– alleviation of nutrient constraints Time course of modelled wood growth follows that estimated from wood inventory
Loss in NEP of 120-year cycle during later growth Gain in NEP of 120-year cycle during post-harvest periods in 60-year cycle Greater wood accumulation in 120-year cycle Is long-term NEP greater in a 60 vs. 120 year harvest cycle?
reduction in wood harvest removal gain in soil C storage Changes in C stocks of a coastal Douglas fir after four logging cycles of 60 years each or two logging cycles of 120 years each D C Stock 4 x 60 Years 2 x 120 Years ------------g C m-2 ------------ Removal wood 53425 45592 other 432 160 D Soil -2400 +5398 DOC Export 447 447 DIC Export 1252 1366 Total NEP 53156 52963
Effects of drought and climate change on NEP of boreal aspen
Drought during 2001 – 2003 adversely affected productivity of this aspen forest Annual climate data at the Southern Old Aspen site during the period of flux measurement Year Average Temp. Precipitation 0C mm 1994 1.00 477 1995 0.18 420 1996 -1.06 442 1997 2.66 413 1998 3.31 547 1999 2.89 479 2000 1.26 484 2001 2.96 235 2002 0.69 286 2003 1.83 261 2004 0.77 741 drought
Model runs for boreal aspen • Ecosys was initialized with • the site and soil properties given in Table 1 • the biological properties of aspen and hazelnut • Ecosys was then run for 3 disturbance cycles of 100 years • each under repeated 11-year sequences of 1994 – 2004 meteorological data (shortwave radiation, air temperature, relative humidity, wind speed and precipitation measured 10 m above the canopy). • concentrations of NH4+ and NO3- in precipitation were set to 0.1 and 0.4 g N m-3 respectively • concentrations of CO2 and NH3 in the atmosphere were set at 370 and 0.0025 mmol mol-1 respectively. • During each cycle, a stand-replacing fire was implemented on 30 June of the first year • all above-ground phytomass and 0.6 of the surface litter was destroyed. • Results were compared with measured values during the 85th – 87th years of the model run under 2001 – 2003 weather
Site and soil characteristics of the Southern Old Aspen Site. Site Characteristics Latitude: 53.6 ° N Longitude: 106.2 ° W Elevation: 600 m Mean annual precipitation 484 mm Mean annual temperature 1.5˚C Dominant vegetation: aspen (Populus tremuloides) regenerated from fire in 1919 Understory vegetation: hazelnut (Corylus cornuta) Mean basal area (1994) 33.5 m2 ha-1 (overstory) Soil Characteristics† Horizon L F H Ae Bt Bmk Ck1 Ck2 Depth to bottom (m)0.02 0.05 0.10 0.32 0.70 0.85 1.25 1.85 Bulk Density (Mg m-3) 0.09 0.11 0.19 1.38 1.53 1.67 1.67 1.67 Field Capacity (m3 m-3)0.45 0.45 0.40 0.24 0.23 0.19 0.18 0.21 Wilting Point (m3 m-3) 0.10 0.10 0.10 0.10 0.13 0.11 0.10 0.13 Sand (g kg-1) - - - 589 568 485 484 484 Silt (g kg-1) - - - 293 187 280 276 276 Clay (g kg-1) - - - 118 245 235 240 240 Coarse Fragments (m3 m-3)0 0 0 0 0 0 0 0 pH 6.4 6.5 6.6 6.6 6.5 6.8 8.5 8.5 CEC (cmol(+) kg-1) 103 119 120 9.2 14 12 12 10 Organic C (g kg-1) 430 415 313 6.2 3.4 2.0 3.4 3.4 Total N (g Mg-1) 20199 21573 19522 521 317 286 200 200 Total P (g Mg-1) 1442 1269 1220 212 304 459 448 448 † Anderson, D. 1998. BOREAS TE-01 Soils Data over the SSA Tower Sites in Raster Format, Available online at [http://www-eosdis.ornl.gov/] from the ORNL Distributed Active Archive Center, Oak Ridge National Laboratory, Oak Ridge, Tennessee, U.S.A.]
Soil water depletion occurred earlier as the drought progressed TDR measurements 0 – 15 cm Modelled water contents 0 – 15 cm
Forest water relations remained favourable during 2001 yc >= -2.0 MPa high gc, but note midafternoon declines on some days
LE > H midafternoon declines during August LE effluxes and CO2 influxes were rapid during 2001 EC measurements model values
Forest water relations were adversely affected by drought later in 2002 yc < -2.0 MPa, doesn’t recover overnight large midafternoon declines in gc
LE < H LE declined below H and CO2 influxes declined later in 2002
yc < -2.5 MPa gc remains very low Forest water relations were adversely affected by drought during most of 2003
LE << H LE and CO2 influxes declined sharply in 2003
drying rainfall Soil CO2 effluxes are a major component of ecosystem CO2 exchange
Daily NEP rose less and declined earlier as drought progressed
NEP declined during drought Annual carbon budgets at the Southern Old Aspen site modelled by ecosys (M) and estimated (E)† from EC flux and biometric measurements during three years of drought. 2001 2002 2003 S E S E S E ---------------------------------g C m-2 ----------------------------------- GPP 17911413‡,1615¥ 1287 1032‡ 1290 1057‡ Ra: above613 353±51¥ 479 544 : below308 452¥ 220 242 : total 921 805¥ 699 786 NPP 870 810¥ 588 504 Litter: above 254 211 208 :below 217 217 193 :exudation 147 127 100 : total 618 555 501 D wood C 195 123 670 D root C 48 -70 -40 D reserve C 9 -42 25 Rh 595 510¥ 509 481 Soil resp’n 903 962±192¥ 726 723 Eco. resp’n 1519 1046‡ 1205 888‡ 1267 954‡ 1315±253¥ D SOC 68 36 43 D Soil CO2 -45 10 -23 NEP275320 82 125 23 91 Peak LAI§3.7, 1.92.9, 2.3‡ 3.2, 1.8 2.1, 1.9‡ 3.1, 1.8 2.0, 2.1‡ †from Barr et al. (2004) ‡ all modelled autotrophic values are the sums of overstory (aspen) and understory (hazelnut) components. § aspen and hazelnut respectively ¥ from Griffis et al. (2004). Above-ground value for leaves and bole only