Download
1 / 18
211 likes | 595 Vues
Regulation of Glycolysis/Gluconeogenesis Citric Acid Cycle / TCA cycle / Kreb’s cycle Electron Transport Chain (Oxidative Phosphorylation). 3 major points of regulation of glycolysis. Hexokinase Phosphofructokinase-1 Pyruvate kinase. -32.9. -24.5. Each regulatory reaction

E N D
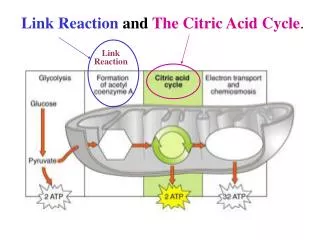
Regulation of Glycolysis/Gluconeogenesis Citric Acid Cycle / TCA cycle / Kreb’s cycle Electron Transport Chain (Oxidative Phosphorylation)
3 major points of regulation of glycolysis Hexokinase Phosphofructokinase-1 Pyruvate kinase -32.9 -24.5 Each regulatory reaction is held far from equilibrium (large – DG) Each regulatory step in glycolysis is coordinately regulated with gluconeogenesis Substrate Cycle * * -26.4
Each regulatory step in glycolysis is coordinately regulated with gluconeogenesis Futile/Substrate cycle: Pi ATP ADP H2O Glycolysis Gluconeogenesis Sum: ATP + H20 ADP + Pi If allowed to occur at the same time – utilization of ATP without useful metabolic work being done Cycles provide important means of regulation *
Hexokinase Muscle – High affinity for glucose Usually saturated and working at maximal rate Inhibited by glucose 6-phosphate (product inhibition) Liver – much lower affinity (higher Km) for glucose. Allows liver to process high levels of glucose Not inhibited by glucose 6-phosphate Muscle Liver
Coordinate Regulation of PFK-1 and FBPase-1 (regulation by energy state of cell) * Commitment step of glucose into glycolysis PFK-1 – inhibited by signals of adequate energy supplies ATP Citrate Activated by signals of low energy supplies ADP AMP FBPase-1 – Inhibited by signals of low energy supplies AMP
Hormonal regulation of glycolysis and gluconeogenesis mediated by fructose 2,6 bisphosphate F26BP activates PFK-1 (binds to allosteric site and increases its affinity for its substrate (F6-phosphate) F26BP inactivates FBPase 1 (decreases its affinity for its substrate (F1,6 BP))
Where does F2,6 Bisphosphate come from? Hormonal regulation of PFK-2 / FBPase-1 Formation of F26BP Breakdown of F26BP 1 bifunctional NZ with 2 separate activities regulated by insulin and glucagon **Regulation of NZ is by phosphorylation** Glucagon stimulates phosphorylation of PFK-2/FBPase 2 -Activation of FBPase-2 activity (phosphatase) -Reduction of F26BP - Glycolysis Gluconeogenesis Insulin stimulates dephosphorylation of PFK-2/FBPase 2 -Activation of PFK2 activity (Kinase) -Increase in F26BP - Glycolysis Gluconeogenesis
Enzymes of glycogen metabolism are regulated by allosteric and hormonal mechanisms Allosteric Regulation Glycogen Synthase Glycogen Phosphorylase Activation G6P AMP Inhibition ADP, Pi ATP, G6P, Glucose Signals of high energy supply (G6P, ATP) stimulate glycogen synthesis and inhibit glycogen breakdown. Signals of low energy supply (ADP, AMP) stimulate glycogen breakdown and inhibit glycogen synthesis
Hormonal Regulation of glycogen synthesis and breakdown – Covalent Modification Glycogen breakdown Inhibition of Glycogen breakdown Glucagon Activation of phosphoprotein phosphatase -1 DeP of Glycogen phosphorylase Phosphorylase kinase Activation of PKA (via cAMP) (IA) P of phosphorylase kinase P of Glycogen phosphorylase And P of Glycogen synthase (A) (IA) Stimulation of glyc breakdown Inhibition of glyc synthesis (A) (IA)
Fed State - Insulin • Glucose enters hepatocytes through transporter • 2) Synthesis of glycolytic enzymes 3) inactivation of GSK3 and activation of PP1 Activate glycogen synthase and inactivate glycogen phosphorylase Glycolysis Glycogen synthase ↓Glycogen breakdown Fasting State - glucagon Activation of PKA through cAMP 1) Activates phosphorylase kinase glycogen phosphorylase 2) Inactivates glycogen synthase 3) Phosphorylates PFK-2/FBPase-2 in F2,6BP 4) Inactivates pyruvate kinase ↓Glycolysis ↓Glycogen synthase Glycogen breakdown
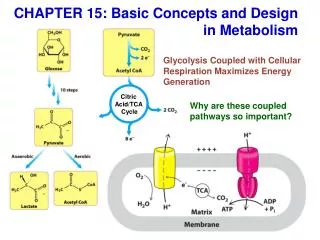
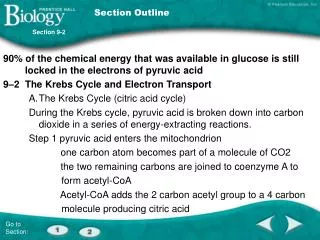
Overview of Steps Glycolysis Glucose Pyruvate Cytoplasm Pyruvate Transition/Prep Phase Mitochondria Acetyl - CoA NADH FADH2 Citric Acid Cycle C1 C3 ATP synthase C2 C4 ATP Electron Transport
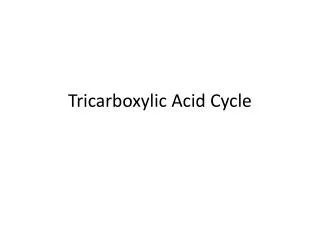
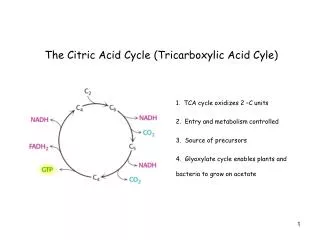
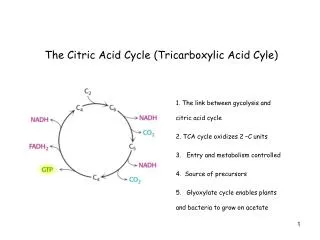
Citric Acid Cycle 2 C acetyl group combines with 4 C oxaloacetate to yield 6 C citrate 1- 1 Glucose 2 pyruvates 2- Carbons lost in pathway as C02 -These Cs are not from acetyl-coA 3- Oxaloacetate consumed in the 1st step is regenerated in the last. 4- Energy produced is transferred as energy-rich electrons to NAD+ to yield NADH or to FAD+ to yield FADH2 5- 2 rounds of Cycle yields: 4 CO2, 6 NADH, 2 FADH2, and 2 ATP 6- CAC is amphibolic – has a role in oxidation of carbohydrates and provides precursors for other pathways (ex – AA metabolism) Pyruvate Dehydrogenase 2 Acetyl-CoA Citrate (C6) Oxaloacetate (C4) CoASH Isocitrate (C6) C02 NADH NADH Malate a-ketoglutarate (C5) CoASH Fumarate (C4) C02 FADH2 NADH Succinate (C4) CoASH Succinyl co-A (C4) GTP / ATP Substrate level phosphorylation
Ca2 Ca2 Ca2 Regulation of Citric Acid Cycle A- Substrate Availability (oxaloacetate; acetyl-CoA) B- Product Inhibition 1- PD C- Competitive Feedback Inhibition NADH Citrate Regulated enzymes of CAC 4-CS 1- Pyruvate Dehydrogenase (irreversible) Product/Feedback inhibition Covalent Modification (Phosphorylation = inactive) 2- ID * 2- Isocitrate Dehydrogenase Product/ Feedback Inhibition * 3- a-Ketoglutarate Dehydrogenase 3-KD * 4- Citrate synthase * All function far from equilibrium (- ΔG) NADH and Acetyl CoA compete with NAD+ and CoA for binding sites – competetive feedback inhibition
2H+ 4H+ 4H+ Cyt. C Intermembrane space Complex I Membrane Soluble Coenzyme Q Cyt’s Cu FMN FeS Cyt’s FeS Complex II Complex III Complex IV FAD FeS Matrix NADH NAD+ FAD+ ½ O2 + 2H+ FADH2 Succinate H20 Fumarate 1- Electrons from NADH and FADH2 are passed through redox centers of 4 membrane bound complexes and 2 membrane soluble electron shuttles 2-During electron transfer, protons are translocated from the matrix into the intermembrane space (Complex 1, Complex III, and Complex IV) 3- Final reduction is of molecular O2 4- Electrons from NADH yield 2.5 ATP; Electrons from FADH2 yield 1.5 ATP
Proton Motive Force - Chemiosmotic theory Storage of energy as a proton/voltage gradient across a membrane 1- In ETC, the transport of H+ from low [H+] to high [H+] requires energy (ENDERGONIC) 2- Discharge of proton is EXERGONIC Free energy of discharge of proton gradient is harnessed by ATP synthase Outer membrane Intermembrane space Low pH H+ H+ H+ Fo ++++++ ++++++ lll lV V l Inner membrane --------- --------- H+ ATP High pH F1 Oxidative phosphorylation
Electron transport and ATP synthesis are “coupled” ATP synthesis requires discharge of proton gradient: Proton gradient cannot be discharged without synthesis of ATP: Proton gradient is established by electron transporting complexes. No drug uncoupler added Inhibitor added DNP DNP DNP ATP Synthesis 02 Consumption Time Time Time Uncoupler of ETC Destroys proton gradient; No stored energy for ATP; DOES NOT stop electron flow; Oxygen still being consumed Electrons flowing through ETC; O2 is being consumed; ATP is being synthesized Inhibitor of ETC Stops flow of electrons; No proton pumping; No proton motive force; No longer consuming O2; No longer making ATP