Stat 1301 More on Regression
Stat 1301 More on Regression. Outline of Lecture. 1. Regression Effect and Regression Fallacy 2. Regression Line as Least Squares Line 3. Extrapolation 4. Multiple Regression. 1. Regression Effect and Regression Fallacy. Test - Retest Situation.

Stat 1301 More on Regression
E N D
Presentation Transcript
Outline of Lecture 1. Regression Effect and Regression Fallacy 2. Regression Line as Least Squares Line 3. Extrapolation 4. Multiple Regression
Test - Retest Situation Hypothetical Grades for the First 2 Tests in a Class of STAT 1301 AVGx = 75 SDx = 10 (Test 1) AVGy = 75 SDy = 10 (Test 2) r = 0.7
Regression Line: Y = .7X + 22.5 ^ Predict the score on Test 2 for a student whose Test 1 score was... (a) 95 (b) 60
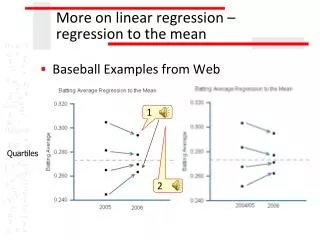
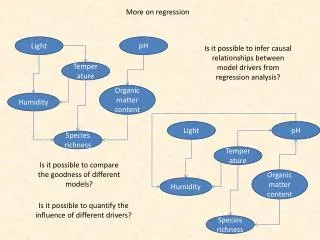
The Regression Effect The Regression Fallacy • Test-retest situation: • - Bottom group on Test 1 does better on Test 2 • - Top group on Test 1 falls back on Test 2 attributing the regression effect to something besides natural spread around the line.
Regression Effect - Explanation Students scoring 95 on Test 1 3 categories (a) Students who will average 95 for the course (b) Great students having a bad day (c) “Pretty good” students having a good day - There are more students in category (c) than in (b) - Thus, we expect the “average” performance for those who scored 95 on Test 1 to drop
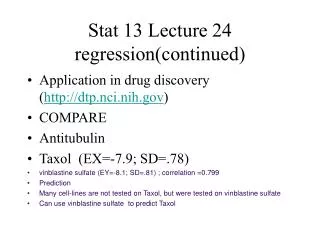
Regression Effect - Examples 4-yr-olds with IQ’s of 120 typically have adult IQ’s around 110. 4-yr-olds with IQ’s of 70 typically have adult IQ’s around 85. Of major league baseball teams with winning records, typically 2/3 win fewer games the next year.
Note: • The regression effect does not explain a change in averages • If r > 0: • if X is above AVGx, then the predicted Y must be above AVGy -if X is below AVGx, then the predicted Y must be below AVGy
The regression line has smallest RMS size of deviations from points to the line.
The regression line has smallest RMS size of deviations from points to the line. • The regression line is also called the least squares line.
3. Extrapolation • Predicting beyond the range of predictor variables
3. Extrapolation • Predicting beyond the range of predictor variables • NOT a good idea
4. Multiple Regression Using more than one independent variable to predict dependent variable. Example: Predict Y = son’s height Using X1= father’s height X2= mother’s height
4. Multiple Regression Using more than one independent variable to predict dependent variable. Example: Predict Y = son’s height Using X1= father’s height X2= mother’s height Equation: Y = m1X1 + m2X2 + b