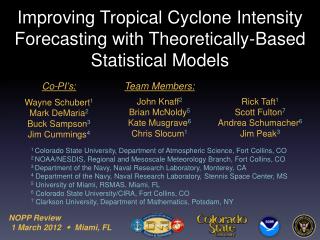
Improving Tropical Cyclone Intensity Forecasting with Theoretically-Based Statistical Models
Improving Tropical Cyclone Intensity Forecasting with Theoretically-Based Statistical Models. Co-PI’s: Wayne Schubert 1 Mark DeMaria 2 Buck Sampson 3 Jim Cummings 4 Team Members: John Knaff 2 Brian McNoldy 5 Kate Musgrave 6 Chris Slocum 1 Rick Taft 1 Scott Fulton 7 Andrea Schumacher 6

Improving Tropical Cyclone Intensity Forecasting with Theoretically-Based Statistical Models
E N D
Presentation Transcript
Improving Tropical Cyclone Intensity Forecasting with Theoretically-Based Statistical Models Co-PI’s: Wayne Schubert1 Mark DeMaria2 Buck Sampson3 Jim Cummings4 Team Members: John Knaff2 Brian McNoldy5 Kate Musgrave6 Chris Slocum1 Rick Taft1 Scott Fulton7 Andrea Schumacher6 Jim Peak3 1 Colorado State University, Department of Atmospheric Science, Fort Collins, CO 2 NOAA/NESDIS, Regional and Mesoscale Meteorology Branch, Fort Collins, CO 3 Department of the Navy, Naval Research Laboratory, Monterey, CA 4 Department of the Navy, Naval Research Laboratory, Stennis Space Center, MS 5 University of Miami, RSMAS, Miami, FL 6 Colorado State University/CIRA, Fort Collins, CO 7 Clarkson University, Department of Mathematics, Potsdam, NY NOPP Review 1 March 2012 Miami, FL
Project Overview Part I: • Theoretical study of the inner core of tropical cyclones Part II: • Observational study of upper ocean response to tropical cyclones Part III: • Application of results from Parts I and II to intensity forecast models NOPP Review 1 March 2012 Miami, FL
Part I:Theoretical Study of the Inner Core of Tropical Cyclones Impact of Vortex Structure on Tropical Cyclone Response to Diabatic Heating
Introduction • Several studies have examined TCs using Eliassen's balanced vortex model (1952) • Vigh and Schubert (2009) investigated effects of diabatic heating inside and outside the radius of maximum wind (RMW) on intensification • Their use of Rankine wind profiles limited the vorticity to within the RMW... we're expanding to include the effect of vorticity “skirts” on the efficiency of heating to intensify vortices
Eliassen’s Balanced Vortex Model • Governing equations: • Assume static stability is constant: • Assume inertial stability is function of r only: • To focus on role of inertial stability, neglect baroclinic terms
Geopotential Tendency Equation • Instead of eliminating and solving for the secondary circulation, eliminate and to get the GTE • GTE is a 2nd order elliptic PDE • Use separation of variables • Choose appropriate BC’s • Assume the following vertical structure:
Resulting Radial Structure Problem • 2nd order ODE • Have developed code in Mathematica and Fortran to solve this problem • Rossby length: • Other radial structure functions can then be recovered • For example:
Initial Profiles for Idealized Runs Skirt Edge RMW Heating Inside RMW Heating Inside Skirt Skirt Edge RMW Heating Across RMW Heating Outside Skirt
Results for Idealized Runs Skirt Edge RMW Heating Inside RMW Heating Inside Skirt RMW Heating Across RMW Heating Outside Skirt Skirt Edge
Mathematica to Fortran Mathematica example: Heating inside RMW Fortran example: Heating inside RMW Converting from Mathematica to Fortran allows for a wider variety of profile specifications and for greater portability and automation
Testing GTE with HWRF • The GTE model is being tested with HWRF model fields: • as initial conditions • as baselines for result comparisons • HWRF model fields allow for regular assessment and serve as a bridge to incorporating observed heating and wind profiles
Case Studies Hurricane Igor 2010 Hurricane Katia 2011
Igor: 10 Sep 2010 1200 UTC, 90hr fcst ‘Initial’ Time 14 Sep 2010 0600 UTC T + 6 hr T + 12 hr T + 24 hr
Katia: 03 Sep 2010 1200 UTC, 36hr fcst ‘Initial’ Time 05 Sep 2010 0000 UTC T + 6 hr T + 12 hr T + 24 hr
Differences in Vortex Profiles • Some discrepancies at longer lead-times can also be attributed to the DH profile changing over time Caution must be used in trying to carry instantaneous tendencies out to longer times
Kinetic Energy vs. Max. Wind • KE200vsVmax • When heating is inside or across the RMW, Vmax increases more than the kinetic energy (right side of curve) • When heating is outside the RMW, KE increases more than Vmax (left side of curve) (from Maclayet al. 2008: 1244 AL & EP recon cases)
Tropical Cyclone Lifecycle KE1000 vs. Vmax Lifecycle based on results of Ooyama 1969
TC Lifecycle: Wilma 2005 10/22 10/21 10/20 10/23 10/18 10/19 10/17
Part IAccomplishments & Future Work • Mathematica code for solving idealized problems • Analysis of Geopotential Tendency Equation for a range of idealized parameters • Fortran code for solving more realistic problems • Apply to HWRF model output as a diagnostic tool (in coordination with HFIP diagnostic team) • Apply to real data derived from microwave imagery
Part II: Observational Study of Upper Ocean Response to Tropical Cyclones Assessing Upper Oceanic Response to Tropical Cyclone Passage NOPP Review 2012
Response to TC Passage • Makes use of six years of the NCODA-based ocean heat content files developed in Year-1 • Composite analyses are used to investigate the type, magnitude, and persistence of the upper ocean’s response to TC passage • Complete findings submitted for publication: • Knaff, J. A., M. DeMaria, C. R. Sampson, J. E. Peak, J. Cummings, and W. Schubert, 2012: Upper Oceanic Energy Response to Tropical Cyclone Passage. In revision Journal of Climate. NOPP Review 2012
NCODA Ocean Heat Content Files • 12 different fields including OHC26C, OHC20C, T100, Td, where d is depth of the mixed layer defined by temperature and density gradients and maximum stability • Seven-years of data • Processing moved to operations at FNMOC • Methods and dataset has been documented and submitted for publication: • Peak, J. E., C. R. Sampson, J. Cummings, J. A. Knaff, M. DeMaria, and W. Schubert, 2012: An upper ocean thermal field metrics dataset. Submitted to Geophysical Research Letters. NOPP Review 2012
Composite Analyses • Ocean variables and their climatologies are interpolated to the points associated with global six-hourly TC tracks at 10 separate lead and lag times • Six-years of data were used • Examine the temporal changes of the upper ocean prior to and following TC passage • Account for the seasonal cycle • Composite the responses as a function of initial ocean conditions, latitude, translation speed, a simplified kinetic energy based on wind radii, and intensity • Use the composites to develop simple parameterizations of upper ocean responses to TC passage as a function of routinely measured TC metrics NOPP Review 2012
Data and Climatologies Sept. 15 Climatologies Sept. 15, 2005 NOPP Review 2012
Example: OHC26C 10-day Response NOPP Review 2012
Example: OHC26C Persistence NOPP Review 2012
Summary of Findings • An average sized hurricane results in • ~ 0.6 C cooling • 12 kJ/cm^2 decrease of OHC26C • ~0.5 C cooling of the upper 100m of the ocean • SST cooling persists on the order of 30 days • The upper ocean response persists on the order of 60 days • TC size helps determine the response and existing information seems adequate • SST cooling can be estimated from KE and latitude • OHC and T100 changes can be estimated by KE, initial conditions and translation speed NOPP Review 2012
Future Plans • Use upper ocean metric fields: • Real-time LGEM, SHIPS and RII in the Western North Pacific • For re-examination of potential intensity • Assessment of different metrics in SHIPS/LGEM framework. (i.e., Do other measures of oceanic heat content provide superior information to statistical-dynamic forecasts of intensity change?) • A reanalysis of ocean data going further back in time is being done under different funding at NRL Stennis NOPP Review 2012
Part III:Application of Results from Parts I and II to Intensity Forecast Models NOPP Review 1 March 2012 Miami, FL
Intensity Forecast Models • NHC Statistical Intensity Models: • SHIFOR: No-skill baseline with climatology and persistence input • Max wind at t=0, -12 hr, lat/lon at t=0, -12 hr, Julian Day • SHIPS: Linear regression model with additional input from GFS forecast fields, SST analyses, GOES data and satellite altimetry • LGEM: Generalization of SHIPS that relaxes linear assumption • SPICE (experimental): Ensemble of SHIPS and LGEM with input from GFS, HWRF and GFDL • Rapid Intensification Index: Subset of SHIPS input to estimate probability of RI • Dynamical Models: • HWRF and GFDL • Coupled ocean-atmosphere 3-D prediction systems
NOPP Statistical Model Tasks • Develop SHIPS, LGEM and Rapid Intensification Index for Western Pacific • If successful, transition to JTWC operations • Improve statistical intensity models • New parameters from NCODA • SST cooling algorithm • Input from balance model solutions for cases with aircraft and satellite data
West Pacific Accomplishments • SHIPS database developed for WPAC • 2000-2011 cases • GFS analyses • NCODA sea surface temperatures and oceanic heat content (OHC) • Satellite altimetry OHC before 2005 • Geostationary satellite infrared imagery • SHIPS and LGEM fitted to WPAC database • Coordination with NRL on implementation in the ATCF for 2012 season • Planned for May 2012 along with Atlantic and East Pacific versions for NHC
Preliminary SHIPS/LGEM Hind-cast Errors with Real Time Track Forecast Input (2008-2010 WPAC Sample) Skill Relative to ST5D Mean Absolute Error
The Rapid Intensification Index • SHIPS and LGEM fit to basin-wide statistics using least squares approaches • Outliers (rapid intensity changes) not captured well • Kaplan, DeMaria, Knaff (2003, 2010) developed method for identification of RI cases • Subset of SHIPS parameters most related to RI • Discriminate analysis approach estimates probability of RI • WPAC implementation of SHIPS/LGEM will include the rapid intensification index
Example of RII from 2011 Season(Hurricane Adrian in the East Pacific) • LGEM forecasted 24 hr intensity increase of 19 kt (35 to 54 kt) • BUT: the RII suggested increases could be much larger • Observed 24 hr increase was 35 kt
Next Steps for Part III • Implement West Pacific SHIPS/LGEM/RII on the ATCF for JTWC • Continue statistical model improvements for West Pacific, East Pacific and Atlantic • Test new ocean parameters from NCODA • Test balance model solutions using input from aircraft and satellite on
Checklist from B. Sampson for West Pacific LGEM, SHIPS and RII in ATCF • Obtain 6-h GFS grib files real-time • Develop reader for IR imagery • Generate 2004-2011 IR imagery dataset for testing • Produce NWP model input files (PACK files) • Implement LGEM, SHIPS and RII code in objective aid run • Expected by May 15, 2012
Example Aircraft/Satellite Dataset Radial profiles of tangential wind and heating rate (input to balance model) Flight level winds from Air Force Reserve C-130 and heating rate from AMSU precipitation product
Upcoming Conference Talks30th Conference on Hurricanes and Tropical Meteorology(15-20 April 2012, Ponte Vedra Beach, FL) • DeMaria, M., J. A. Knaff, A. B. Schumacher, and J. Kaplan, 2012: Improving Tropical Cyclone Rapid Intensity Change Forecasts. • Wed. 18 April 2012 at 9:30 am, Session 8B (Tropical Cyclone Intensity Change II) • Knaff, J. A., M. DeMaria, C. R. Sampson, J. E. Peak, J. Cummings, and W. Schubert, 2012: The Upper Ocean's Thermal Response to Tropical Cyclones. • Fri. 20 April 2012 at 2:45 pm, Session 16D (Ocean Observations & Air-Sea Interaction) • Peak, J. E., C. R. Sampson, J. Cummings, J. A. Knaff, M. DeMaria, and W. H. Schubert, 2012: An Upper Ocean Thermal Field Metrics Dataset. • Fri. 20 April 2012 at 2:15 pm, Session 16D (Ocean Observations & Air-Sea Interaction) • Slocum, C. J., 2012: Determining Tropical Cyclone Intensity Change through Balanced Vortex Model Applications. • Wed.18 April 2012 at 10 am, Session 8B (Tropical Cyclone Intensity Change II)
Upcoming Papers • Knaff, J. A., M. DeMaria, C. R. Sampson, J. E. Peak, J. Cummings, and W. H. Schubert, 2012: Upper oceanic energy response to tropical cyclone passage. Submitted to J. Climate. • Musgrave, K. D., R. K. Taft, J. L. Vigh, B. D. McNoldy, and W. H. Schubert, 2012: Time evolution of the intensity and size of tropical cyclones. J. Adv. Model. Earth Syst., in press. • Peak, J. E., C. R. Sampson, J. Cummings, J. A. Knaff, M. DeMaria, and W. H. Schubert, 2012: An upper ocean thermal field metrics dataset. Submitted to Geophys. Res. Lett.