Download
1 / 14
140 likes | 277 Vues
Are Atlantic basin tropical cyclone intensity forecasts improving?. 67 th IHC / 2013 Tropical Cyclone Research Forum. Jonathan R. Moskaitis. Naval Research Laboratory Monterey, CA. 7 March 2013. OFCL yearly Atlantic intensity MAE, with weighted trends.

E N D
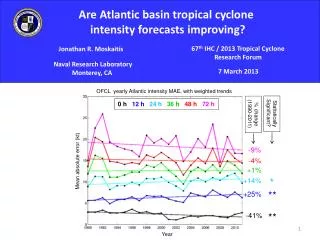
Are Atlantic basin tropical cyclone intensity forecasts improving? 67th IHC / 2013 Tropical Cyclone Research Forum Jonathan R. Moskaitis Naval Research Laboratory Monterey, CA 7 March 2013 OFCL yearly Atlantic intensity MAE, with weighted trends 0 h 12 h24 h36 h48 h72 h Statistically Significant? % change (1990-2011) -9% -4% Mean absolute error (kt) +1% * +14% ** +25% ** -41% Year
Introduction In order to understand the OFCL intensity MAE trends, it is necessary to consider how both the statistics of the forecasts and the statistics of the best track analyses have changed over the years. OFCL yearly Atlantic intensity MAE, with weighted trends 0 h 12 h24 h36 h48 h72 h Statistically Significant? % change (1990-2011) -9% -4% Mean absolute error (kt) +1% * +14% ** +25% ** -41% Year
Objective Investigate best track intensities over the 1990-2011 period in order to discern if significant changes to the statistics of the verifying analyses have taken place (2) Evaluate the implications of the evolution of the best track intensity statistics over the years for the interpretation of the OFCL intensity MAE trends Data: ATCF a-decks and b-decks Intensity change: Irene (2011) best track intensity Best track intensity change ΔI = 30 kt Δt = 96 h Best track intensity change time interval
Best track intensity change: 1990-2000 vs. 2001-2011 ΔI relative frequency distribution, Δt = 12 h • Lower relative frequency of small-magnitude intensity changes for 2001-2011 than for 1990-2000 • Higher relative frequency of large-magnitude intensity changes for 2001-2011 than for 1990-2000
Best track intensity change: 1990-2000 vs. 2001-2011 ΔI relative frequency distribution, Δt = 24 h • Lower relative frequency of small-magnitude intensity changes for 2001-2011 than for 1990-2000 • Higher relative frequency of large-magnitude intensity changes for 2001-2011 than for 1990-2000
Best track intensity change: 1990-2000 vs. 2001-2011 ΔI relative frequency distribution, Δt = 48 h • Lower relative frequency of small-magnitude intensity changes for 2001-2011 than for 1990-2000 • Higher relative frequency of large-magnitude intensity changes for 2001-2011 than for 1990-2000
Best track intensity change: 1990-2000 vs. 2001-2011 ΔI relative frequency distribution, Δt = 72 h • Lower relative frequency of small-magnitude intensity changes for 2001-2011 than for 1990-2000 • Higher relative frequency of large-magnitude intensity changes for 2001-2011 than for 1990-2000
Best track intensity change: 1990-2000 vs. 2001-2011 ΔI relative frequency distribution, Δt = 72 h -h2 -h1 h1 h2 RFS = Relative frequency of small-magnitude intensity change, | ΔI | ≤ h1 RFL= Relative frequency of large-magnitude intensity change, | ΔI | ≥ h2
Best track intensity change: Trends in yearly samples Δt = 12h Δt = 24 h Relative frequency of small-magnitude intensity change (RFS) Relative frequency of large-magnitude intensity change (RFL) Relative frequency % change (1990-2011) Δt = 48h Δt = 72 h Relative frequency Year Year For all Δt, the trend indicates decreasing relative frequency of small-magnitude intensity changes and increasing relative frequency of large-magnitude intensity changes
Best track intensity change: Trends in yearly samples Yearly AAIC with weighted trend, Δt = 12, 24, 36, 48, 72 h AAIC = Average absolute intensity change 12 h24 h36 h48 h72 h % change (1990-2011) +21% +21% * +25% +32% * ** +44% Statistically Significant? % change (1990-2011) For all Δt, there is an increasing trend in AAIC
Best track intensity change: Relationship with OFCL intensity MAE • AAIC can be interpreted as a measure of forecast difficulty • AAIC = MAE of persistence intensity forecasts • How does AAIC compare to OFCL intensity MAE? AAIC for Δt = 12 h andOFCL MAE for lead time = 12 h AAIC for Δt = 24 h andOFCL MAE for lead time = 24 h +44% +32% Yearly value and weighted trend (kt) +25% +14% Standardized residuals ρ = 0.72 ρ = 0.87
Best track intensity change: Relationship with OFCL intensity MAE • AAIC can be interpreted as a measure of forecast difficulty • AAIC = MAE of persistence intensity forecasts • How does AAIC compare to OFCL intensity MAE? AAIC for Δt = 12 h andOFCL MAE for lead time = 48h AAIC for Δt = 24 h andOFCL MAE for lead time = 72h +21% +21% Yearly value and weighted trend (kt) -9% -4% Standardized residuals ρ = 0.81 ρ = 0.61 On the decadal time scale, AAIC (forecast difficulty) and OFCL MAE have different trends. The slope of AAIC trend > slope of OFCL MAE trend. Year-to-year departures from the trend lines are highly correlated, suggesting the AAIC departure controls the OFCL MAE departure.
Best track intensity change: Relationship with OFCL intensity MAE • Normalized MAE = OFCL MAE / AAIC • Accounts for forecast difficulty, as measured by AAIC 48 h * -13% * -21% 12 h 72 h * -14% * -23% 24 h For all lead times, there is a statistically significant decreasing trend in normalized MAE * -20% 36 h
Summary and conclusions Analysis of Atlantic best track intensities during the 1990-2011 period shows: • Decreasing trend in relative frequency of small-magnitude intensity changes (RFS) • Increasing trend in relative frequency of large-magnitude intensity changes (RFL) • Increasing trend in average absolute intensity change (AAIC) Trends in OFCL intensity MAE should be interpreted in context of the AAIC, to account for evolution in the statistics of the best track intensities on the decadal time scale • AAIC can be interpreted as a measure of forecast difficulty • After normalizing by AAIC, OFCL intensity MAE shows statistically significant • decreasing trends at 12, 24, 36, 48, and 72 h Question for future research: Why are there trends in AAIC, RFS, and RFL?