Download

1 / 18
180 likes | 362 Vues
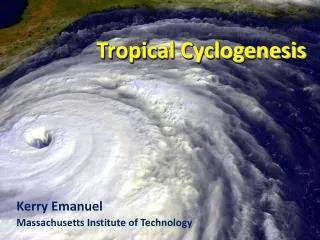
Probabilistic Verification of Ensemble Forecasts of Tropical Cyclogenesis. Sharanya J. Majumdar RSMAS / University of Miami Ryan D. Torn SUNY at Albany IHC / Tropical Cyclone Research Forum, 3/6/13. How to define a TC in a model?.

E N D
Probabilistic Verification of Ensemble Forecasts of Tropical Cyclogenesis Sharanya J. Majumdar RSMAS / University of Miami Ryan D. Torn SUNY at Albany IHC / Tropical Cyclone Research Forum, 3/6/13
How to define a TC in a model? • LOW-LEVEL CYCLONIC CIRCULATION.700-850 hPa layer mean relative vorticity, averaged within a disk of radius 200 km, exceeding 8x 10⁻⁵s-1. • WARM CORE.Local 200-850 hPa geopotential thickness (averaged within a disk of r=100 km) exceeding environmental thickness (averaged within a disk of r=1000 km) by 45 m. • CLOSED SURFACE LOW.Closed surface low with minimum sea level pressure < 1012 hPa. • CALIBRATE values in analysis using NHC best track.
0000 UTC 14th 1200 UTC 14th 0000 UTC 15th CIRC THICK MSLP
108 h ECMWF Ensemble Forecast of pre-Karl, init. 0000 UTC 10 Sept 2010 CIRC THICK Probability (TC at 108 h) = 68% MSLP
Verification • Homogeneous Comparison: Aug 15 – Sep 30 2010 • 3-day ECMWF ensemble forecasts, 00 and 12 UTC • 3-day WRF/EnKF ensemble forecasts, 00 and 12 UTC • ECMWF ensemble forecasts, Jun 1 – Nov 30, 2010-2012 • 7-day forecasts, 00 UTC only • All forecasts up to and including genesis. • Verification: NHC best track. TC or not TC. Our question: what is the probability that a TC exists at XX h? (with time tolerance of 1 day). Focus on timing. Slightly different from NHC question: what is the probability that a TC forms within the next XX h?
Conclusions • WRF/EnKF and ECMWF are comparable for 1-3 day forecasts (Aug – Sep 2010) • Reliability diagrams out to at least 96 h generally slope upwards, average gradient less than 1. • Dependence on definition of TC? • Stratify statistics based on genesis mechanisms.