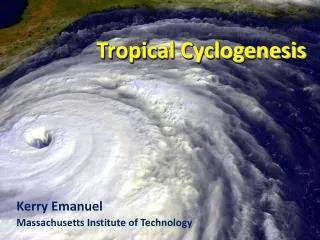
Tropical Cyclogenesis
Tropical Cyclogenesis. Kerry Emanuel Massachusetts Institute of Technology. Two Points of View. Macroscopic : What sets the frequency of tropical cyclones on the planet? Are tropical cyclones agents in a system that maintains itself in some critical state?

Tropical Cyclogenesis
E N D
Presentation Transcript
Tropical Cyclogenesis Kerry Emanuel Massachusetts Institute of Technology
Two Points of View • Macroscopic: What sets the frequency of tropical cyclones on the planet? Are tropical cyclones agents in a system that maintains itself in some critical state? • Microscopic: What are the dynamics and physics underlying tropical cyclogenesis?
Global Tropical Cyclone Frequency, 1970-2008 Data Sources: NOAA/TPC and NAVY/JTWC
Simplest Statistical Equilibrium State:Radiative-Convective Equilibrium
Vertically integrated water vapor at 4 days (Nolan et al., QJRMS, 2007)
Vertically integrated water vapor at 4 (a), 6 (b), 8 (c), and 10 (d) days (Nolan et al., QJRMS, 2007)
Numerical simulations of RC equilibrium show that, under some conditions, moist convection self-aggregates Day 10 Day 50 From Bretherton et al. (2005)
Effect of Self-Aggregation on Humidity (Bretherton et al. , 2005)
Empirical Necessary Conditions for Self-Aggregation (after Held et al., 1993; Bretherton et al., 2005; Nolan et al.; 2007) • Small vertical shear of horizontal wind • Interaction of radiation with clouds and/or water vapor • Feedback of convective downdraft surface winds on surface fluxes • Sufficiently high surface temperature
Self-Aggregation is Temperature-Dependent (Nolan et al., 2007; Emanuel and Khairoutdinov, in preparation, 2009)
Hypothesis • At high temperature, convection self-aggregates • →Horizontally averaged humidity drops dramatically • →Reduced greenhouse effect cools system • →Convection disaggregates • →Humidity increases, system warms • →System wants to be near phase transition to aggregated state
Recipe for Self-Organized Criticality(First proposed by David Neelin, but by different mechanism) • System should reside near critical threshold for self-aggregation • Convective cluster size should follow power law distribution
Properties • PBL quasi-equilibrium enforced • Bulk aerodynamic surface fluxes with convective gustiness • Albedo and emissivity simple weighted average of clear and cloudy regions • Water vapor-dependent clear sky emissivity • Horizontally uniform temperature but variable moist static energy (i.e. water vapor) at mid-level • Vertical motion calculated to enforce zero horizontal temperature gradient • PBL moist static energy adjusted to yield zero domain-averaged vertical motion • Slow horizontal diffusion of moisture at mid-level
ResultsSelf-Aggregation Occurs for: • Small or negative gross moist stability • Sufficiently large feedback between convective gustiness and surface enthalpy fluxes • Sufficiently high surface temperature
Summary of Toy Model Results • Self-aggregation driven by convective gustiness at high temperature • No self-aggregation at low temperature • Aggregated state is much drier at mid levels • System tends towards self-organized criticality (SOC) • Climate sensitivity of SOC state much lower (0.04 K/Wm-2) than sensitivity of uniform convection (0.2 K/Wm-2)
Preliminary Suggestion of Self-Organized Criticality in Full-Physics CRM
Extension to f-plane Distance between vortex centers scales as Vmax/f
Two More Indications of Large-scale Control of Genesis Rates: • Success of Genesis Indices • Success of Random Seeding Technique
New Genesis Potential Index: • 850 hPa absolute vorticity (h) • 850 – 250 hPa shear (S) • Potential intensity (PI) • Non-dimensional subsaturation of the middle troposphere:
Interannual Variability No Significant Correlations Outside the Atlantic!
Random Seeding/Natural Selection Step 1: Seed each ocean basin with a very large number of weak, randomly located cyclones Step 2: Cyclones are assumed to move with the large scale atmospheric flow in which they are embedded, plus a correction for beta drift Step 3: Run the CHIPS model for each cyclone, and note how many achieve at least tropical storm strength Step 4: Using the small fraction of surviving events, determine storm statistics. Details: Emanuel et al., BAMS, 2008
Calibration Absolute genesis frequency calibrated to observed global average, 1980-2005
Genesis rates(Driven by NCEP reanalysis) Western North Pacific Southern Hemisphere Eastern North Pacific North Indian Ocean Atlantic
Genesis rates(Driven by ERA40 Reanalysis) Western North Pacific Southern Hemisphere Eastern North Pacific Atlantic North Indian Ocean
Cumulative Distribution of Storm Lifetime Peak Wind Speed, with Sample of 2946Synthetic Tracks
Captures effects of regional climate phenomena (e.g. ENSO, AMM)
Year by Year Comparison with Best Track and with Knutson et al., 2007
The Microscopic View: Why Hurricanes Need Cold-Core Embryos in which to Develop
Pronounced entropy (moist static energy) minimum in middle troposphere Saturation at SST
Genesis: The Conventional Wisdom Genesis results from organized convection + vorticity Example: Numerous cumulonimbus clouds warm and gradually moisten their environment. This warming…produces a pressure fall at the surface, because warm air weighs less than cool air. The slowly converging horizontal winds near the surface respond to this slight drop of pressure by accelerating inward. But the increased inflow produces increased lifting, so that the thunderstorms become more numerous and intense. The feedback loop is now established. -- from “The Atmosphere”, Anthes et al., 1978
This hypothesis was effectively disproved in 1901 by J. von Hann: “Since a thundercloud does not give any appreciable pressure fall [at the surface] but even a pressure rise, it would be unreasonable to assume that a magnifying of this process would cause the strongest pressure falls known” -- As paraphrased by Bergeron, QJRMS, 1954
Hypothesis: All tropical cyclones originate in a nearly saturated, cold-core mesoscale or synoptic scale air column with cyclonic rotation aloft and, often, weak anticyclonic rotation near the surface
Reasoning: • Downdrafts must be stopped • Can only be stopped by saturating air on the mesoscale • Saturation + convective neutrality = uniform moist static energy • But moist static energy is conserved • Moist static energy must be reduced near surface • Air must be cold above boundary layer • Cold anomaly must be in rotational balance
Pre-mixing h* profile Vertically mixed h profile Saturation at SST