Download
1 / 27
270 likes | 376 Vues
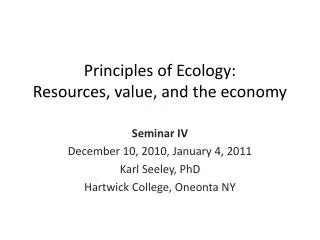
Principles of Ecology: Resources, value, and the economy. Seminar IV December 10, 2010, January 4, 2011 Karl Seeley, PhD Hartwick College, Oneonta NY. The growth cycle, with resources. Consumption. Saving. Increased output. Investment. B. Innovation. A. Innovation.

E N D
Principles of Ecology:Resources, value, and the economy Seminar IV December 10, 2010, January 4, 2011 Karl Seeley, PhD Hartwick College, Oneonta NY
The growth cycle, with resources Consumption Saving Increased output Investment B. Innovation A. Innovation Increased, improved capital Available resources Potential resources
Cheaper production P If you build the necessary machines, Supply curve for stuff in general moves to the right Price may fall somewhat, but definitely sell a lot more Make more money Q Output in general • What makes for cheaper production? • Cheap resources • Technological innovation
The growth of capital P Cheaper production methods mean that new capital will be highly profitable So demand for capital … … increases Cheaper production methods also mean that the supply of capital … … increases Q Capital
GDP Trend Time
Circular flow diagram Wages, capital rent ($) II. Including investment Labor, capital Export expenditure (Ex) Firms Households (HH) Goods, services ($) Import expenditure (Im) Consumption expenditure Financial markets I S T G Government
GDP Trend Actual Time
Business cycle • Fluctuations in the economy driven by changes in demand • Demand can come from the creation of money, backed by creation of assets • The assets are claims on stuff in the future • Actually claims on value in the future
Graph by Gail Tverberg Fig. 12 in http://www.theoildrum.com/node/5969
Graph by Gail Tverberg Fig. 13 in http://www.theoildrum.com/node/5969
Tech bubble Stable ratio between current output and claims on future output Housing bubble Net worth data from U.S. Federal Reserve, Flow of Funds, Table B.100, “Balance Sheet of Households and Nonprofit Organizations” GDP data from Bureau of Economic Analysis, Table 1.1.5, “Gross Domestic Product” Author’s calculations
Growth and value • Ecological vision: Growth for humans means capturing more resources • Rearranging ecosystems so we get more of what’s there, or so they capture more, or finding new ones • Economic vision: growth is an increase in value, not necessarily linked to resources • Where does value come from?
Sources of value • You can increase your production of value by: • Doing more stuff • Producing more goods • Providing more services • Having that stuff valued at a higher price … but prices are relative, so how do you make more in total?
Numerical example • Two sectors, G and S • Total labor L normalized to 100 • Output per worker y, total output Y • Nominal prices PK, real prices pK • Set PG = 1 (goods are numeraire item) • Nominal value of output V, real value v
L: the quantity of labor • y: the physical productivity of labor (amount of goods or services produced per worker) • Y:the total output of a sector • P: the price of a sector’s output • P y: the value of an individual worker’s output in each sector • V: the total production of value in a sector, and for the economy as a whole.
Naïve result • Productivity for everyone went up by the amount of productivity increase in goods • But choice of numeraire was arbitrary • Services as the numeraire would suggest no increase in value despite more output Get real prices via a price index
Price index: take the cost of the Period-1 basket, at Period-2 prices, and divide it by the cost of the Period-1 basket at Period-1 prices. • In period 1, the average worker consumes ____ units of goods and ____ units of services. • The price of goods is $1.00/unit and the price of services is $1.50/unit, so the average worker spends $____ on his/her basket (C1). • Buying the same quantities of goods and services, but paying $1.00 for goods and $5.00 for services, the average worker would spend $____ (C2). • So the increase in the overall price level can be calculated as C2 / C1 = ____. • Divide the Period-2 prices to get the real prices for Period 2.
Price index and real prices C1 = $1.00 21 + $1.50 6 = $30 C2 = $1.00 21 + $5.00 6 = $51 C2 / C1 = 1.7
Energy use per worker • More in goods than in services • Normalize to e = 1 in services • Significant factor in productivity growth • Cleveland et al. (1984) • Simplify to make it identical • Energy use per worker in goods grows at same rate as output per worker
Illusory efficiency • Value created per worker has gone up by 96% • Energy per worker has gone up by only 42% • 38% gain in output per worker independent of increased energy use • But by assumption, all increase in real productivity is based on energy • Increased productivity in goods increases value of services • Simultaneously allows labor to move to the high-value, lower-energy service sector
Illusory efficiency • The apparent efficiency gain itself depends on using more energy