Download
1 / 36
360 likes | 588 Vues
An Experimental Investigation of Turbulent Boundary Layer Flow over Surface-Mounted Circular Cavities. Jesse Dybenko Eric Savory Department of Mechanical and Materials Engineering University of Western Ontario, London, ON May 24, 2006. Flow Geometry. Motivation.

E N D
An Experimental Investigation of TurbulentBoundaryLayerFlow over Surface-Mounted Circular Cavities Jesse Dybenko Eric Savory Department of Mechanical and Materials Engineering University of Western Ontario, London, ON May 24, 2006
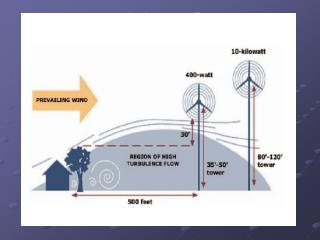
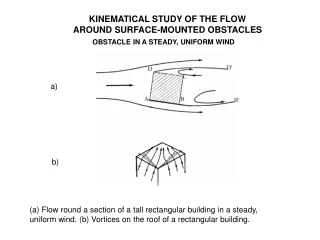
Motivation • Cavities are found on aircraft and automobiles • Landing gear wheel wells • Recessed windows • Sun roofs • Symmetric geometry, asymmetric mean flow • Not well researched • A better understanding of these flows could lead to drag and noise reduction for airframes
Background • Peak in cavity drag at h/D 0.5
Background • Cavity Feedback Resonance (Rossiter, 1964)
Background • Vortices shed from upstream cavity lip
Background • Vortices convected downstream
Background • Vortex impinges on downstream lip
Background • Acoustic pulse radiates upstream
Background • Pulse disturbs shear layer – causes vortex to be shed. Feedback loop is closed.
Background • Frequency associated with this mechanism can be estimated using Rossiter’s Formula (Rossiter, 1964): • f is predicted oscillation frequency, m is integer mode number, is vortex-sound pulse lag-time factor, M is free stream Mach number, is ratio of vortex convection velocity to free stream velocity
Background • Oscillation can also occur according to the depth scale of the cavity: depth-mode resonance • Can also estimate frequency due to this mechanism: • f is predicted oscillation frequency, N is odd-integer mode number, c is speed of sound in air, h is cavity depth
Major Objectives • To understand the causes of abnormal flow in cavity and in its wake for h/D 0.5 • What causes this flow to differ from flow at other depth configurations? • To investigate the fluctuating nature of the flows at various cavity depths and their relationship with resulting cavity drag
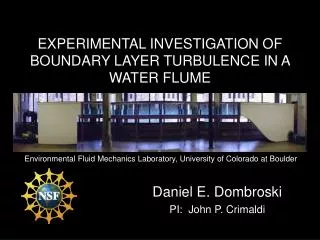
Experimental Techniques • Three cavity depth ratios were used for measurements: • h/D = 0.20, 0.47 and 0.70 • Cavity depth was only variable • Three systems were used for measurements: • Pressure transducers • Surface pressure distribution • Microphones • Acoustic response of cavity • Two-component hot-wire anemometry • Mean Velocity and Turbulence Profiles in wake
Experimental Variables • U0 = 27.0 m/s, δ = 55 mm (δ/D = 0.72), ReD = 1.3 x 10⁵
Results and Discussion • Mean pressure distributions on sidewall
Results and Discussion • Mean surface pressure distributions on cavity base
Results and Discussion • Vortex Skeleton Diagrams – h/D = 0.2
Results and Discussion • Vortex Skeleton Diagrams – h/D = 0.47
Results and Discussion • Vortex Skeleton Diagrams – h/D = 0.70
Results and Discussion • RMS pressure distributions on sidewall
Results and Discussion • RMS pressure distributions on cavity base
Results and Discussion • Drag coefficient comparison
Results and Discussion • Wake velocity profiles – Stream-wise velocity
Results and Discussion • Wake velocity profiles – Stream-wise turbulence
Results and Discussion • Frequency analysis • Estimate Frequencies • Cavity Feedback Resonance: • Predicted first-mode f = 145.5 Hz
Results and Discussion • Frequency analysis • Estimate Frequencies • Depth Mode Resonance: • Predicted first-mode frequencies are depth-dependent, for three depths tested: • h/D = 0.20 f = 2329 Hz • h/D = 0.47 f = 1512 Hz • h/D = 0.70 f = 1164 Hz
Results and Discussion • Frequency analysis – Microphone in base
Results and Discussion • Frequency analysis – Microphone in base
Conclusions • Pressure Measurements • RMS pressure patterns show maxima at shear layer reattachment points and vortex centres • Mean pressure patterns agree well with those done by previous investigators • Integrated drag coefficients also match well with previous data
Conclusions • Wake Flow Analysis • Symmetric velocity and turbulence profiles for h/D = 0.20 • Asymmetric for h/D = 0.47, showing clear, circular trailing vortex feature, which can be disturbed to switch sides • In this feature, mean streamwise velocity is at a minimum, turbulence at a maximum
Conclusions • Frequency analysis • Possible link between cavity feedback resonance and abnormal flow behaviour at h/D = 0.47 • Depth mode oscillations occur for h/D = 0.47 and 0.70; 0.20 not deep enough
Recommendations • Aerodynamic Design • If circular cavity required on vehicle frame, shallow holes are best (h/D = 0.20 or less) • low drag, low noise in high frequency band, no resonances
Acknowledgements • Technicians at BLWTL • Prof. Gregory Kopp • University Machine Shop • Advanced Fluid Mechanics Research Group • Tom Hering and Rita Patel
Questions? For additional information on research done by the AFM Research Group, try our website: http://www.eng.uwo.ca/research/afm