Download
1 / 30
340 likes | 831 Vues
CEIS and Significant Disproportionality. Webinar Series. July 31, 2019. Sharon Strong Coon. MISSISSIPPI STATE BOARD OF EDUCATION STRATEGIC PLAN GOALS. 4. 5. 6. 3. 1. 2. All Students Proficient and Showing Growth in All Assessed Areas.

E N D
CEIS and Significant Disproportionality • Webinar Series • July 31, 2019 • Sharon Strong Coon
MISSISSIPPI STATE BOARD OF EDUCATION STRATEGIC PLAN GOALS 4 5 6 3 1 2 All Students Proficient and Showing Growth in All AssessedAreas Every Student Graduates from High School and is Ready for College and Career Every Child Has Accessto a High- Quality Early Childhood Program Every School Has Effective Teachers and Leaders Every Community Effectively Uses a World-Class Data System to Improve Student Outcomes EverySchool and District is Rated “C” or Higher
Important Distinction • Two different calculations are done that address equity • Three indicators (4b, 9, & 10) in the State’s Annual Performance Report address equity • A second analysis happens every year to determine if a district is a disproportionate and must reserve15% of the IDEA budget for Coordinated Early Intervening Services (CEIS) • Today’s discussion deals with the second analysis
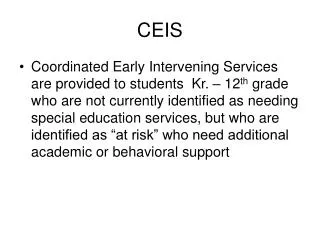
What is Significant Disproportionality? • Disproportionality is an overrepresentation of some racial or ethnic group in a category. • Disproportionality becomes significant when the over representation exceeds a defined threshold.
Why a Revision? • Only 2 to 3 percent of districts nationwide are identified with significant disproportionality and required to take action
Changes to Significant Disproportionality • Require a standard methodology • Clarify that LEAs must review and revise policies, procedures and practices every year significant disproportionality is found • Require that districts identify and address factors contributing to significant disproportionality
Changes to Significant Disproportionality • New Regulations: 20 U.S.C. 1418(d) and 34 CFR §§300.646 and 300.647 • Determine whether significant disproportionality based on race/ethnicity is occurring with respect to the: • Identification of children as children with disabilities, including identification as children with particular impairments • Placement of children in particular educational settings • Incidence, duration, and type of disciplinary actions, including suspensions and expulsions.
Timelines Standard Methodology introduced in December 2016 and stated that States must be in compliance by July 1, 2018 This was put on hold by the Department of Ed and eventually went to litigation in the COPAA v. DeVos. March 7, 2019 the Court found in favor of COPAA.
Timelines On May 20, 2019, The U.S. Department of Education’s Office of Special Education and Rehabilitative Services issued the guidance below. Pursuant to the plain language of the December 19, 2016 Equity in IDEA regulation on significant disproportionality, and in conjunction with the March 7, 2019 decision in COPAA v. Devos, the Department expects States to calculate significant disproportionality for the 2018–2019 school year using the 2016 rule’s standard methodology, or to recalculate using the 2016 rule’s standard methodology if a different methodology has already been used for this school year.
What’s Different? • No longer examine students in ”resource” placements (SB) • Discipline expanded to in-school suspensions • Discipline expanded to include students with less than10 days of in-school or out-of-school suspension • Discipline expanded to look at discipline in the aggregate
Additional Flexibilities • Consecutive Years: States can choose to identify an LEA as having Significant Disproportionality only after an LEA exceeds the risk ratio threshold for up to three prior consecutive years, including the current reporting year. • Reasonable Progress: A state need not identify an LEA with Significant Disproportionality if the LEA is making “reasonable progress” in lowering the risk ratios, where reasonable progress is determined by the state.
Methodology – Risk Ratio Must calculate a risk ration for each LEA for each of the racial/ethnic groups for each analysis category (98 calculations)
Methodology – Risk Ratio - Identification Number of children from racial/ethnic group in a disability category Number of enrolled children from same racial/ethnic group Number of all other children in disability category Number of all other enrolled children
Methodology – Risk Ratio - Placement Number of children from racial/ethnic group in a placement category Number of children with disabilities from same racial/ethnic group Number of all other children in placement category Number of all other children with disabilities
Methodology – Risk Ratio - Discipline Number of children from racial/ethnic group in a discipline category Number of children with disabilities from same racial/ethnic group Number of all other children in discipline category Number of all other children with disabilities
Minimum Cell Size Number of children from racial/ethnic group in a disability category Number of enrolled children from same racial/ethnic group Number of all other children in disability category Number of all other enrolled children
Minimum N-Size Number of children from racial/ethnic group in a disability category Number of enrolled children from same racial/ethnic group Number of all other children in disability category Number of all other enrolled children
Alternate Risk Ratio Number of children from racial/ethnic group in a disability category Number of enrolled children from same racial/ethnic group Number of all other children in disability category Number of all other enrolled children District Level Data State Level Data
What is Your Data Telling You? Discipline Categories
Sharon Strong Coon – scoon@mdek12.org • Minnia Winters – mwinters@mdek12.org • Gloria Lacey – glacey@mdek12.org • Rhonda Douglas – rdouglas@mdek12.org • Darrell Latham – dlatham@mdek12.org