Download
1 / 72
720 likes | 902 Vues
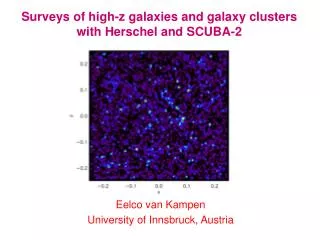
Surveys of high-z galaxies and galaxy clusters with AzTEC. Sungeun Kim Astronomy & Space Science Department Sejong University. 144 element spiderweb bolo array – S. Golwala. AzTEC (Astronomical Thermal Emission Camera) Instrument.

E N D
Surveys of high-z galaxies and galaxy clusters with AzTEC Sungeun Kim Astronomy & Space Science Department Sejong University
144 element spiderweb bolo array – S. Golwala AzTEC (Astronomical Thermal Emission Camera)Instrument • AzTEC is a bolometer camera(designed for imaging) • AC voltage output directly proportional to optical power. • Detectors read outcontinuously at 64Hz. • System designed tohave good low freq.stability (AC biased) • All commands andsignals pass via fiber optics (low flux demands low systematics)
AzTEC Collaborators • G. Wilson (PI), J. Austermann, K. Scott, T. Perera, M. Yun (UMass, USA) • J. Bock, N. Scoville (Caltech, USA) • P. Mauskopf (Cardiff, UK) • I. Aretxaga, D. Hughes (INAOE, Mexico) • J. Lowenthal (Smith College, USA) • E. Chapin, M. Halpern, A. Pope, D. Scott (UBC, Canada) • K. Coppin (University of Durham, UK) • Y. Kang, S. Youn, Y. Kim, K. Kim (Sejong Univ., Korea)
AzTEC • New ‘Science’ detector array • 110/144 working detectors (others possibly repairable) • Pass band: 1.1 mm, 2.1 mm • Raw detector sensitivity: 15mJy • Beamsize: 18 arcsec. FWHM • Field of View: 4.8 arcmin • Jiggle Mapping Speed: 4hrs/FOV/mJy2 • Scan Mapping Speed: 20 arcmin2/hr/mJy2 Continuous JCMT Observing, Nov 10 – Jan 2 > 400 hrs observing time on SMG projects
Pre-shipment checkout Optics alignment at JCMT
AzTEC • New ‘Science’ detector array • 110/144 working detectors (others possibly repairable) • Pass band: 1.1 mm, 2.1 mm • Raw detector sensitivity: 15mJy • Beamsize: 18 arcsec. FWHM • Field of View: 4.8 arcmin • Jiggle Mapping Speed: 4hrs/FOV/mJy2 • Scan Mapping Speed: 20 arcmin2/hr/mJy2 Continuous JCMT Observing, Nov 10 – Jan 2 > 400 hrs observing time on SMG projects
The array orientation is fixed in Azimuth and Elevation, the scan-angle in the RA-DEC plane for a raster scan map continuously changes due to sky rotation. Oversized optics minimizemicrophonic pickup 24bit digitization of signals atcryostat eliminates pickup fromlong cable runs The opacity at 225 GHz was recorded every 10 minutes by the CSO tau Monitor.
AzTEC/JCMT SMG Studies ~1deg2
Dust emission: far-IR & sub-mm Dusty star-forming galaxies emit much of their light at IR to mm wavelengths Figure from van Kampen (2005) • AzTEC is aimed for making a series of confusion-limited surveys of the Submillimeter Galaxies (SMGs), environments of • clusters at 1.1 mm wavelength in order to study the dusty starburst populations both in and behind clusters, and blank field.
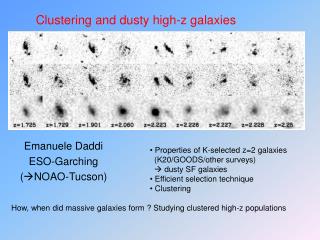
Submillimeter Galaxies SMM J02399-0136 (Genzel et al. 03) • Population of extremely luminous high-redshift dust-obscured galaxies detected by their sub-mm and mm wavelength emission. • Massive galaxies, with SFR of ~500-1000 Msun/yr. Sub-mm SCUBA surveys in late 90s (Smail et al 2000, Ivison et al. 98). • SMGs: F850 > 1 mJy. Spectroscopic redshifts for higher redshift population (z~2), median F850 ~ few mJy for z~2 population. • Before Spitzer and SHARC-2 observations (Kovacs et al. 2006), mostly 850 micron, some 450 micron, radio observations, CO, and some mm imaging. ㅋ=2.5
Submm Galaxies as tracers of structure formation z=1 AzTEC bandpass (model SMG spectrum by Efstathiou, Rowan-Robinson and Siebenmorgen, 2000) • One of the most exciting developments of the past decade has been the resolution of the cosmic far-infrared background into discrete sources, providing a • first glimpse of the rapid build-up of massive galaxies in the early universe long predicted by theory.
Submm Galaxies as tracers of structure formation z=1 z=2 AzTEC bandpass (model SMG spectrum by Efstathiou, Rowan-Robinson and Siebenmorgen, 2000) • Deep, wide blank-field surveys at mm & sub-mm wavelengths have shown that ultraluminous infrared galaxies (ULIRGs) at z>1, contribute significantly to the • Observed far-IR background.
Submm Galaxies as tracers of structure formation z=1 z=2 z=5 AzTEC bandpass (model SMG spectrum by Efstathiou, Rowan-Robinson and Siebenmorgen, 2000) • Multi-wavelegnth follow-up studies of these so-called sub-mm galaxies (SMGs) suggest that they are massive, young galaxies seen during the period of rapid stellar mass build-up with very high specific star formation rates at z>1. Here are four key questions we would like to address from AzTEC SMG surveys.
Scientific Goals of SMG Studies • How is the SMG population distributed in redshift? • Are SMG redshift associations linked to overdensities of other more numerous galaxy classes at the same redshift? • Do they reside in such massive Halos? • How are SMGs distributed in relation to large scale structure? Overzier et al. (2003) Answering these questions and more will require large confusion limited surveys with multi-spectral follow-up.
Galaxy Density Map of COSMOS Both MAMBO and BOLOCAM surveys cover a low galaxy density region of the COSMOS field, whilst our new AzTEC observations are designed to examine the impact of massive large- Scale foreground structures on SMG Surveys in order to provide a measure of the importance of cosmic variance in the observed source density at millimeter wavelengths. from Scoville et al. (2007), with the boundaries of the AzTEC, Bolocam, and MAMBO mm surveys (including a massive galaxy cluster at z=0.73)
AzTEC/COSMOS 34 raster-scan Observations, Each centered at (RA,DEC)= (10h00m00s, 02deg36’00’’) 0.3deg2 region Scan speed of 90”/s-150”/s Mapping speed: 34 arcmin2mJy-2hr-1 (strong function of Sky opacity at 225 GHz)
Disadvantages to Chopping • sensitive to differential pickup from dish (secondary support, temperature gradients, etc.) • resolve out large scale structure • Advantages to Rastering • beam response stationary on telescope • uniform coverage achievable despite incomplete array • unlimited sky coverage possible
Typical AzTEC Chopped Signal 2Jy Mean traces out time evolution of atmosphere + variable offsets
AzTEC/BOLOCAM Comparison • Map shows >20% maximum coverage region, with 50% and 75% contours overlaid. Black circles are >3.5 sigma sources, and those in the source catalogue (75% region) are labeled by their number. Purple circles indicate Bolocam sources. Solid purple line marks the Bolocam 1.9 mJy rms contour, dashed line is Bolocam 2.8 mJy rms contour. 2 coincident sources: Bolocam #1 is 3.5 arcsec from AzTEC #1 and Bolocam #13 is 3.6 arcsec from AzTEC #6. Scott et al. (2008)
COSMOS Clustering measurement • 2-pt angular correlation function made using >2.0 sigma sources. Used a binsize of 36 arcsec, limited to angular separations between 60 and 500 arcsec. No strong clustering signal detected on any scale here. Angular correlation function w(θ) is projection of the spatial function on the sky and is defined in terms of the joint probability delta P= N2[1+w(θ)]dὨ1Ὠ2 (N; mean surface density of objects); w=0, distribution is homogeneous.
Galaxy Density Map of COSMOS • from Scoville et al. (2007), with the boundaries of the AzTEC, Bolocam, and MAMBO mm surveys (including a massive galaxy cluster at z=0.73)
Cross-Correlation function is computed between the galaxy overdensity map and the AzTEC map No obvious peak at the Center. Image Credit: Scott et al. (2006)
AzTEC/COSMOS: Conclusion • 0.3 deg2 region imaged within the COSMOS with 1.3 mJy/beam at 1.1mm • 50 sources found S/N>3.5; 16 detected with S/N>4.5, where the number of false-detections is zero; 7 of >5σ sources confirmed with SMA. • AzTEC sources are spread throughout the field and only 3 are located in z=0.73 cluster environment. • Our catalogue is 50% complete at an intrinsic flux density of 4 mJy, and 100% is complete at 7 mJy. • Fraction of AzTEC sources with potential radio counterparts is 36% and is consistent with that found in SCUBA/SHADES survey (Ivison et al. 2007) at similar fluxes. • A detailed comparison of the IRAC color-color plots and SEDs shows that AGNs and SMGs are distinct from each other due to intrinsic differences in their energy source and dust distribution. SMGs as a group have a flatter SED in comparison with AGNs. Only 20% of the objects overlap in the color-color plots and this suggests that SMGs powered by an AGN are not common. In the context of ULIRG-QSO evolutionary senario (Sanders et al. 1988; Norman & Scoville 1988), the little overlap between the AGNs and the SMG population indicates that transition period is much shorter than the duration of the SMG or the IR AGN phase. • Estimates of resolved fraction of millimeter CIB due to radio & mid-IR galaxy populations is 7±1% & 21±3% respectively.
(a) Empty squares are SMGs securely identified by radio and CO interferometric imaging. Filled squares and pentagons are SMGs identified as “starburst” and “starburst+AGN” by Spitzer IRS spectra, respectively (Menendez-Delmestre et al. 2007; Valiante et al. 2007; Rigby et al. 2008; Pope et al. 2008). IR QSOs with power-law spectrum identified in the FLS field by Lacy et al. and Martinez-Sansigre et al. (2008) are shown as stars. Small dots represent 4000 random field galaxies in the COSMOS field (Sandetrs et al. 2007), and the large circle centered near (-0.4,-0.4) represents the centroid of the IRAC sources in the FLS (Lacy et al. 2004). The long-dashed line outlines the region for AGNs proposed by Lacy et al. The solid line shows the extended region we propose for the identification of SMG counterparts. (b) Filled circles are 9 SMGs identified by direct SMA measurements and empty circles represent the foreground/interloper IRAC sources. (c) Redshift evolution colour-colour tracks for 3 different starburst ages based on theoretical starburst SED models and filled and empty squares along the redshift evolution colour tracks mark the redshifts of z=0.5,1,2,3,4,and 5. The thick solid line represents power-law spectrum sources with s=0.3-1.0. (d) Effects of extinction are demonstrated by the 72 Myr old starburst colour-colour model tracks with total extinction of AV=50 and 200 (Yun et al. 2008). Figure Credit: Yun et al. (2008) • Among 50 SMG candidates in COSMOS, • 7 AzTEC sources are confirmed with SMA • interferometric imaging (Younger et al. 2007). • IRAC color-color plots of SMGs are systematically bluer than AGN identification and consistent with 30-70 Myr old starbursts observed at redshifts between z~1 and z~5 (Yun et al. 2008). • Majority of SMGs appear scattered about the model SED colour tracks, consistent with their Spitzer IRS spectra being characteristic of starburst-dominated systems. For a given model SED, the IRAC color becomes monotonically redder with increasing redshift at z>1, and most • SMGs have colors consistent with model SEDs redshifted to z=1-5; the weak dependence on extinction AV can be understood since optical depth is greatly reduced at these long wavelengths. • As redshift increases, the IRAC bands begin to probe the near-IR to optical bands, and an increasing dependence on extinction is expected. IRAC colors of the two model SEDs diverge at z>2, with the higher extinction AV=200 model predicting redder IRAC colors as expected.
IRAC color-color plot Hot dust • Lacy et al. (2004) from Spitzer FLS. Dashed lines mark “AGN-demarcated region” clustering
τ Td SFR Spectral Energy Distribution for the Starburst Model • Contribution functions & SEDs • from Efstathiou (2000). • Cartoon by Y. Kim
Overall, starbursts age and redshift as the dominant physical parameters affect the observed IRAC colors. SMGs with reddest IRAC colors requires young (<30Myr old) starbursts at high redshifts (z>3) or a power-law AGN dominating the rest frame near-IR SED. • Young, dusty starbursts exhibit red IRAC colors, and red IRAC color is not unique to power-law AGNs. The popular AGN identification methods using red IRAC colors, such as by Lacy et al. (2004) and Stern et al. (2005) should be cautious.
AzTEC/COSMOS: Conclusion • 0.3 deg2 region imaged within the COSMOS with 1.3 mJy/beam at 1.1mm • 50 sources found S/N>3.5; 16 detected with S/N>4.5, where the number of false-detections is zero; 7 of >5σ sources confirmed with SMA; IRAC color-color plots indicate that SMGs are systematically bluer, consistent with 30 to 70 Myr old starbursts observed at redshifts between z~1 and z~5. • AzTEC sources are spread throughout the field and only 3 are located in z=0.73 cluster environment. • Our catalogue is 50% complete at an intrinsic flux density of 4 mJy, and 100% is complete at 7 mJy. • Fraction of AzTEC sources with potential radio counterparts is 36% and is consistent with that found in SCUBA/SHADES survey (Ivison et al. 2007) at similar fluxes. • A detailed comparison of the IRAC color-color plots and SEDs shows that AGNs and SMGs are distinct from each other due to intrinsic differences in their energy source and dust distribution. SMGs as a group have a flatter SED in comparison with AGNs.Only 20% of the objects overlap in the color-color plots and this suggests that SMGs powered by an AGN are not common. In the context of ULIRG-QSO evolutionary senario (Sanders et al. 1988; Norman & Scoville 1988), the little overlap between the AGNs and the SMG population indicates that transition period is much shorter than the duration of the SMG or the IR AGN phase. • Estimates of resolved fraction of millimeter CIB due to radio & mid-IR galaxy populations is 7±1% & 21±3% respectively.
AzTEC/COSMOS: Conclusion • 0.15 deg2 region imaged within the COSMOS with 1.3 mJy/beam at 1.1mm • 50 sources found S/N>3.5; 16 detected with S/N>4.5, where the number of false-detections is zero; 7 of >5σ sources confirmed with SMA. • AzTEC sources are spread throughout the field and only 3 are located in z=0.73 cluster environment. • Our catalogue is 50% complete at an intrinsic flux density of 4 mJy, and 100% is complete at 7 mJy. • Fraction of AzTEC sources with potential radio counterparts is 36% and is consistent with that found in SCUBA/SHADES survey (Ivison et al. 2007) at similar fluxes. • A detailed comparison of the IRAC color-color plots and SEDs shows that AGNs and SMGs are distinct from each other due to intrinsic differences in their energy source and dust distribution. SMGs as a group have a flatter SED in comparison with AGNs. Only 20% of the SMGs overlap in the color-color plots with AGNs and this suggests that SMGs powered by an AGN are not common. In the context of ULIRG-QSO evolutionary senario (Sanders et al. 1988; Norman & Scoville 1988), the little overlap between the AGNs and the SMG population indicates that transition period is much shorter than the duration of the SMG or the IR AGN phase (Yun et al. 2008). • Estimates of resolved fraction of millimeter CIB due to radio & mid-IR galaxy populations is 7±1% & 21±3% respectively.
Summary Remarks We are starting the transition from SMG discovery to SMG study. AzTEC/JCMT is the first step towards developinga census of the SMG population. AzTEC on the Large Millimeter Telescope cansystematically sample the faint end of the flux spectrum.
LMT/GTM • 50m dia. • 70um surface • 15000 ft alt • Sierra Negra, MX
Summary Remarks We are starting the transition from SMG discovery to SMG study. AzTEC/JCMT is the first step towards developinga census of the SMG population. Large Millimeter Telescope cansystematically sample the faint end of the flux spectrum. Thank you: 감사합니다.
Number Counts and Evolution no evolution Borys et al. 2003
Observationally Speaking: • SCUBA/JCMT, MAMBO/IRAM 30-m, BOLOCAM/CSO • Fewer than100 sources with S/N > 4 • Dynamic range: 1-10 mJy at 850 um • Severely confusion limited • Secure redshifts for only about 20-30 galaxies (controversial!!!) 1.4mJy rms3σ peaks circled Ivison et al. 2000 Laurent et al. 2005
AzTEC Internal Optics Layout Folded optical design minimizes optical microphonic pickup and thermal gradients
~1Jy • Beam Mapping Products: • relative bolometer positions • calibration • beam shapes 42 Jy 2 pW 1010 photons/s
THE BIG QUESTION How does structure form and evolve in the Universe? WMAP 2MASS Z~1500 Z~0.1
THE BIG QUESTION How does non-linear structure form and evolve in the Universe? WMAP SDSS, HST, Chandra … 2MASS Z~1500 Epoch of structureformation Z < few Z~0.1
Hughes et al. 1998 2 arcmin dia. 5 sources > 1mJy (0.05 fW) (300,000 photons/s) CMB 2.7K backlight 0.6 pW 3.6×10⁹ photons/s Atmosphere 20-30K foreground 13.7 pW 8×10¹⁰ photons/s Telescope ~30K foreground 13.7 pW 8×10¹⁰ photons/s
Chopping vs Rastering • Three aspects of mm-wavelength bolometry drive the observational modes: • High Background – Signal/Background ~ 10-5 => Raster preferred to Jiggle chop • Atmosphere => Need algorithm to clean (jiggle preferred to raster?) • Detector Time Constant => Limits speed of any continuous motions
Advantages to Chopping • focus integration time on FOV-sized region • low frequency stability not required
Advantages to Chopping • focus integration time on FOV-sized region • low frequency stability not required
Disadvantages to Chopping • sensitive to differential pickup from dish (secondary support, temperature gradients, etc.) • resolve out large scale structure
PCA Atmosphere Cleaning Raw Signal 100 Detector Power Spectral Density [nV/rt(Hz)] PCA cleaned (3,2) 10 10 0.1 1 Frequency [Hz]
26 22 17 13 Per-pixel Integration Time [s] 9 4 0 AzTEC Rastering Gives Uniform Coverage
26 22 17 13 Per-pixel Integration Time [s] 9 4 0 AzTEC Rastering Gives Uniform Coverage