GAEA Reanalysis Progress Report: HYBRID/ENKF vs 3DVAR Analysis and Forecast Quality Improvements
130 likes | 253 Vues
This report delves into the progress and challenges encountered in GAEA reanalysis experiments, particularly focusing on NCEP HYBRID/ENKF and its throughput issues. It compares the forecasting quality during the 1981-1982 period between HYBRID and 3DVAR methods, noting significant advantages for HYBRID, especially in terms of QBO response. Key findings highlight the effectiveness of improved bias correction methodologies and suggest necessary adjustments in job batching to enhance throughput. The report concludes with proposed next steps for further evaluation of reanalysis systems.

GAEA Reanalysis Progress Report: HYBRID/ENKF vs 3DVAR Analysis and Forecast Quality Improvements
E N D
Presentation Transcript
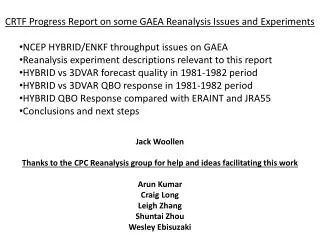
CRTF Progress Report on some GAEA Reanalysis Issues and Experiments • NCEP HYBRID/ENKF throughput issues on GAEA • Reanalysis experiment descriptions relevant to this report • HYBRID vs 3DVAR forecast quality in 1981-1982 period • HYBRID vs 3DVAR QBO response in 1981-1982 period • HYBRID QBO Response compared with ERAINT and JRA55 • Conclusions and next steps Jack Woollen Thanks to the CPC Reanalysis group for help and ideas facilitating this work Arun Kumar Craig Long Leigh Zhang Shuntai Zhou Wesley Ebisuzaki
Hybrid runs on GAEA average between 5-6 days/day Hybrid/ENKF Timing diagram PREP Possible throughput: 3.34hr/day =7.2 days/day Real throughput: 5d/d=7.3hr dead time/day 6d/d=4.0hr dead time/day Cause of dead time: Q wait between batch jobs Conclusion: Need to consolidate batch jobs into bigger jobs to get more throughput GSI EOBS EOMN EUPD 26:20 FCST/POST ECEN EFMN 23:50 EPOS
Five day 500mb height forecast quality is fairly good for the time period in all three systems in both hemispheres. Similar ranking of results is seen in nearly all levels, variables, and regions where anomaly corrections have been calculated. The improvement in 3DVAR quality over CFSR (T254 vs T382) is likely due to model changes and much improved bias correction methodology applied to TOVS data.
The HYBRID/ENKF forecasts are significantly better than 3DVAR or CFSR uniformly in both hemispheres and nearly all lengths and regions.
Time series of analysis, guess, f12-f48 forecast fits to raobs PRHL4 vs PRHL5. A feature of the difference between hybrid and 3dvar systems is illustrated by the hybrid analysis fitting data less well than the 3dvar system, but the hybrid forecasts are uniformly better at all lengths. This could be seen as the situation dependent forecast error structure in the hybrid correcting the background more in some places and less in others, rather than the more “blanket” corrections made by 3dvar. Hybrid corrections are “smarter”, resulting in better forecasts, in general. HYBRID 3DVAR
Comparison of QBO response between NCEP HYBRID vs 3DVAR reanalysis systems shows clearly the advantage of the hybrid methodology in data sparse regions. The red lines are 4day running means of the u-wind observations. The green are 4day running means of the analysis at the data points. The blue is the time series of the analysis mean uwind in +/- 10 degrees latitude. The boxes at the bottom show the daily ob count with green accepted and red rejected. 3DVAR HYBRID
It was supposed that extending the analysis window to 12 hours above 20mb in the tropics might help the 3DVAR draw more to the data and reject less observations. In the plot below right is seen the outcome of this. More data is used and the rejection rate is lower, and the system draws closer to the data, but only marginally. Possibly, looser VarQC cutoffs may help, and along with larger scale forecast error structure specified for this region. 3DVAR 3DVAR w/12hr window
Compare Hybrid QBO Response with JRA55 and ERAINT50-30-20mb all fairly close to data and each other
Compare Hybrid QBO Response with JRA55 and ERAINT10mb has varied results – ERAINT closest overall to the data
The difference between PRHL4 and ERAINT seemed in part due to many rejected rocket-sonde winds in the HYBRID. The plot labeled prhl4-erint below left shows the rejected data by + overlaid on the difference. The plot below right shows the same comparison with PRHN4, like PRHL4, but with wind data above 5mb retained. When the data is assimilated, the HYBRID differences from ERAINT diminish somewhat. This appears to be the cause of the HYBRID westerly hump in Apr-May 1982, and suggests that a loosening of the VarQC tolerances for wind in the tropical stratosphere is important. Up to May 01
Compare Hybrid QBO Response with JRA55 and ERAINTPRHL4 10mb contrasted with PRHN4 (using rocketsondes) PRHN4 resembles a cross between ERAINT and JRA55!
Conclusions and Next Steps Along these Lines • Hybrid/ENKF system as ported from ZEUS gives good results in 1981-1982 test period, significantly better than CFSR everywhere • 3DVAR system performs better than CFSR but needs more work to diagnose and address problems especially at the edges, especially the tropics and the stratosphere • Both systems could benefit from loosened VarQC cutoffs in the tropical stratosphere, the 3DVAR needs larger scale tropical forecast error structure • The next period to look at with HYBRID/ENKF is beginning 1960 to see the transition to ON20 observations including regular aircraft data receipt in 1962 • The next period scheduled for 3DVAR experiments is 1998-1999 to examine the TOVS/ATOVS interface starting in late 1998