Download
1 / 30
300 likes | 455 Vues
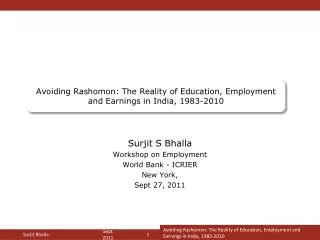
Avoiding Rashomon : The Reality of Education, Employment and Earnings in India, 1983-2010. Surjit S Bhalla Workshop on Employment World Bank - ICRIER New York, Sept 27, 2011. Avoiding Rashomon : The Reality of Education, Employment and Earnings in India, 1983-2010. Overview.

E N D
Avoiding Rashomon: The Reality of Education, Employment and Earnings in India, 1983-2010 Surjit S Bhalla Workshop on Employment World Bank - ICRIER New York, Sept 27, 2011 Avoiding Rashomon: The Reality of Education, Employment and Earnings in India, 1983-2010 SurjitBhalla
Overview • Work in progress • Major focus: Inclusion and growth; • Indian experience – lends itself to myriad of explanations – hence, the Rashomon effect • Official view: Poverty has been declining at only 1 percentage point year, despite a tripling of per capita GDP growth • To accelerate this decline, government needs to provide both direct subsidies (food, diesel, fertilizer) and large scale “digging” ditches employment program. • All of these programs were in effect in 1983, and are in effect in equal and greater force today. Avoiding Rashomon: The Reality of Education, Employment and Earnings in India, 1983-2010 Surjit Bhalla
continued… • Alternate view – the above perspective, and policies, are hugely outdated, most likely wrong, and most likely pernicious for the Indian economy • Reality – globalization a major force, India benefitted hugely, and is today a transformed place; Poverty less than 10 percent of the population (not 32 percent), middle class close to 50 percent • Need different employment and poverty reduction policies Avoiding Rashomon: The Reality of Education, Employment and Earnings in India, 1983-2010 Surjit Bhalla
Avoiding Rashomon: The Reality of Education, Employment and Earnings in India, 1983-2010 Surjit Bhalla
Problems in Measurements – Sharp Decline in NSS Estimates Notes: The survey and national accounts estimates are in current rupees per capita per month; the NA estimate is for the base year prevailing at the time of the survey. Avoiding Rashomon: The Reality of Education, Employment and Earnings in India, 1983-2010 Surjit Bhalla
Poverty – Sharp Decline Avoiding Rashomon: The Reality of Education, Employment and Earnings in India, 1983-2010 Surjit Bhalla
Poverty – MDG reached a decade earlier Avoiding Rashomon: The Reality of Education, Employment and Earnings in India, 1983-2010 Surjit Bhalla
Cost of Poverty Removal • With perfect targeting only 0.4% of GDP needed for Zero Absolute Poverty (Tendulkar Line) Avoiding Rashomon: The Reality of Education, Employment and Earnings in India, 1983-2010 Surjit Bhalla
Consumption Inequality – Increase in last five years Avoiding Rashomon: The Reality of Education, Employment and Earnings in India, 1983-2010 Surjit Bhalla
Income Inequality Avoiding Rashomon: The Reality of Education, Employment and Earnings in India, 1983-2010 Surjit Bhalla
Real Consumption Growth, by percentiles, 1983-2009/10 Avoiding Rashomon: The Reality of Education, Employment and Earnings in India, 1983-2010 Surjit Bhalla
Real Consumption Growth, Difference percentiles, 1983-2009/10 Notes: Each percentile represents the difference in growth rates of the poor and rich percentile e.g. the first percentile represents the difference in growth of the 1st and 100th percentile; second the difference in growth of the 2nd and 99th etc. Avoiding Rashomon: The Reality of Education, Employment and Earnings in India, 1983-2010 Surjit Bhalla
Real Wage Income Per Person Growth, by percentiles, 1983-2009/10 Avoiding Rashomon: The Reality of Education, Employment and Earnings in India, 1983-2010 Surjit Bhalla
Real Wage Income Per Person Growth, Difference percentiles, 1983-2009/10 Notes: Each percentile represents the difference in growth rates of the poor and rich percentile e.g. the first percentile represents the difference in growth of the 1st and 100th percentile; second the difference in growth of the 2nd and 99th etc. Avoiding Rashomon: The Reality of Education, Employment and Earnings in India, 1983-2010 Surjit Bhalla
Sharp Decline in Education Inequality Avoiding Rashomon: The Reality of Education, Employment and Earnings in India, 1983-2010 Surjit Bhalla
Education – Girl Catch-up Avoiding Rashomon: The Reality of Education, Employment and Earnings in India, 1983-2010 Surjit Bhalla
Education – the Poor Catch-up Avoiding Rashomon: The Reality of Education, Employment and Earnings in India, 1983-2010 Surjit Bhalla
Evolution of Middle Class in India, 1980 – 2010 Notes: Middle Class line defined to be the poverty line in developed economies - PPP $8.2 per capita per day 1996 prices or PPP$ 4000 in 2010 prices. In 2010 rupees, the middle class line for India is Rs. 3840 per capita per month or for a family of four, Rs. 1.8 lakhs a year. On a per capita per day basis, the Tendulkar poverty line in 2010 would be approximately Rs. 25; the middle class line, Rs. 121 Avoiding Rashomon: The Reality of Education, Employment and Earnings in India, 1983-2010 Surjit Bhalla
Employment Trends 2004/5-2009/10 • LFPR for age group 15-59 declined from 62.1% to 56.6% • However if we take school/college going into account, LFPR(adj) decline from 71.2% to 68.9% • Thus some decline can be explained by movement from labor force into education • Most of the decline in LFPR is contributed by females in age 25-59 (43.6% to 34.4%), especially rural females (50.7% to 39.9%) • Sharp decline in rural women of age 25-59 self-employed in agriculture (27.2% to 18%) • The poor show a larger decline, but result preliminary Avoiding Rashomon: The Reality of Education, Employment and Earnings in India, 1983-2010 Surjit Bhalla
Labor Force Participation Rates in India, 1983-2010 Avoiding Rashomon: The Reality of Education, Employment and Earnings in India, 1983-2010 Surjit Bhalla
Adjusted for Education: Labor Force Participation Rates *Adjusted labor force includes persons reporting to attend educational institution Avoiding Rashomon: The Reality of Education, Employment and Earnings in India, 1983-2010 Surjit Bhalla
Labor Force Participation Rate by Consumption Levels Avoiding Rashomon: The Reality of Education, Employment and Earnings in India, 1983-2010 Surjit Bhalla
Labor Force Participation Rates (25-59 years) Avoiding Rashomon: The Reality of Education, Employment and Earnings in India, 1983-2010 Surjit Bhalla
Real Wage *Wage was deflated using rural price index of 2004/05 as deflator Avoiding Rashomon: The Reality of Education, Employment and Earnings in India, 1983-2010 Surjit Bhalla
Wage Income Vs Consumption *Wage was deflated using rural price index of 2004/05 as deflator Avoiding Rashomon: The Reality of Education, Employment and Earnings in India, 1983-2010 Surjit Bhalla Sept 2011
Wage Income Vs Consumption *Wage was deflated using rural price index of 2004/05 as deflator Avoiding Rashomon: The Reality of Education, Employment and Earnings in India, 1983-2010 Surjit Bhalla Sept 2011
Workdays: Casual Vs Total Avoiding Rashomon: The Reality of Education, Employment and Earnings in India, 1983-2010 Surjit Bhalla
Labor Force Participation Rate Avoiding Rashomon: The Reality of Education, Employment and Earnings in India, 1983-2010 Surjit Bhalla
Adjusted Labor Force Participation Rate *Adjusted labor force includes persons reporting to attend educational institution Avoiding Rashomon: The Reality of Education, Employment and Earnings in India, 1983-2010 Surjit Bhalla
Avoiding Rashomon: The Reality of Education, Employment and Earnings in India, 1983-2010 Surjit Bhalla