Download
1 / 9
90 likes | 236 Vues
Diagrams and Models with PowerPoint 97 K.L. Edwards March, 2000. This Slide Show takes you through some steps to make diagrams and models as Powerpoint slides or graphics you can insert in your thesis. It also offers guidelines for how to make good slides for a research oral presentation.

E N D
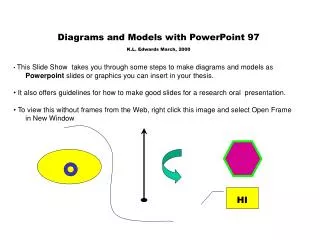
Diagrams and Models with PowerPoint 97 K.L. Edwards March, 2000 • This Slide Show takes you through some steps to make diagrams and models as • Powerpoint slides or graphics you can insert in your thesis. • It also offers guidelines for how to make good slides for a research oral presentation. • To view this without frames from the Web, right click this image and select Open Frame • in New Window HI
C Ca++ Two D Gel Electrophoresis You can learn how to make these forms in this tutorial B A D E1 F E2
A Two D Gel Electrophoresis Diagram A illustrates how to use shapes to make a flow diagram Two D Gel Electrophoresis 4 3 1 2 1 & 2. AutoShapes/BasicShapes or FlowChart in drawing toolbar to select shape. Double rt click on object and select fill color and select width and style of line border. 3. Click on Text Box in drawing toolbar and position cross hairs where you want the text. Select font and size, centering and other font characteristics from the font toolbar. To change text color use Font color icon on drawing toolbar. 4. Select arrows to move on to next step in flow diagram using AutoShapes/Lines or Connectors or Block Arrows. To group a set of elements eg. 1-4 above, so that you can move them as a group: With arrow pointer rt click and drag over all elements. Select Draw/Group from the drawing toolbar. This will keep the elements together. To undo: click on object set, Draw/Ungroup.
B 1 3 4 2 Diagram B below illustrates the use of arrows. 1 Use Auto Shapes/Basic Shapes in the drawing toolbar to make the shape. Choose Fill Color in menu bar. 2. AutoShapes/Connectors to select line/endpt style. Move cursor with cross hairs to begin point on figure. Rt click mouse and drag to end points on figure. Line made. To change width of line and shape and size of end pointers, Double Rt click on the line to bring up options. 3. And 4. Again use AutoShapes/Connectors to select line/endpt style…either a curved or angular line style. Again double rt click the mouse on the arrow to get options. To add text, click Text box icon in the drawing toolbar. Rt click at point where you want to insert text. Highlight text select Font Color in drawing toolbar to change text color
c Use Rotate and arrow color to change arrows Figure C demonstrates the use of the rotate button located on the drawing toolbar. This arrow was free drawn using squiggle line from the Autoshapes/Lines menu. To change the width of the line left click on the line then rt click and select Format Autoshape/Style. Repeat to add arrow at end with /End style. Lft click/rt click the arrow and select Copy. Click elsewhere in document and rt click/Paste to make multiple copies of your arrow. To color your arrows, click on each arrow and select Fill color icon from the Drawing Toolbar. Lastly, to rotate your arrows and move them into a circle: click an arrow and select the Rotate button in the drawing Toolbar, move cursor to arrow and click/drag to rotate or move cursor to middle of arrow to obtain crosshairs and click/drag to new position on page. To make a bar like this representing genes on a chromosome segment, merely create a short rectangle using Autoshapes/Basic shapes or FlowChart. Then copy the rectangle numerous times (here 7) for each gene. Each rectangle can be shortened or lengthened, fill color changed. There will be a small yellow dot on each rectangle which controls the format of the end of the tube: eliminate the end by click moving the yellowdot to the end of the rectangle. Now align the pieces in the order you want. Click/drag to select the entire set, click on Draw/Group to group pieces as one. To add highlights or shading as done here, select Fill/Filleffects from drawing Toolbar. Have fun!
X1 With fill effects, shade X X2 Reduce in size X3 A squiggle connector from Auto Shapes Y Y1 Make color transparent Y2 Copy & replicate Y3 Drag to position E1, E2 Two ways to make a petri dish are shown here. Select oval from Autoshapes/Basic Forms and make X1 and Y1. Use circle shape make colonies (X2 and Y2) as shown at the right…reduce size and copy/paste to make multiple colonies. The medium in the petri dish can be distinquished in Figure X by adding a line X3 using Autoshpaes/Lines. This line will have 3 yellow dots which allow you to fine-tune your line to your petri dish. In Figure Y, 1 oval is made and copy/pasted: each oval is colored differently to distinquish the medium..here green and top half of petri dish is light translucent yellow…select Fill Effect/ More Fill Colors from the Drawing Toolbar and check to box at the bottom labelled Semitransparent. Bring the 2 halves together to form petri dish. Move colonies to interface. Click/drag to select the group of objects and Draw//Group. NOTE: Often when overlaying objects some may lie behind a larger object and become invisible. To cycle thru layers use SHIFT/TAB. To change order of objects, eg bring an object forward in a stack or behind use Draw/Order from the Draw Toolbar
Ca++ F. Drawing a cell model: 1. Use scribble line from Autoshapes/Lines to draw your cell. Copy it and reduce the second cell just slightly. Superimpose images to create the cell wall or extracellular matrix and plasma membrane. Continue with the scribble line to make nucleus, ribosome and ER. Copy those features you want multiples of . Make scribbles large and rduce to appropriate size afterwards. Move components to location desired. Arrows and Text addition were discussed earlier. Don’t forget to Draw/Group all of the selected objects of your final design. To add background to your slide select from top Toolbar Format/Background. Select color by clicking the menu arrow, from this menu choose More Colors and/or Fill Effects for shading style, pattern, textured format etc. Shading can provide a three dimensional sense to your figure. Select Apply to put background on current slide or Apply to All to place same background on every slide in the show. Use scribble line to draw the outline of a cell Ca++
Keep Text simple for a slidepresentation Use Key words, and large font size Use a font that is not proportional, such as Arial Reduce numeric tables to essential numbers only Simplify complicated graphs
Keep your background either light or dark and use sharp contrasting text and image color Making text BOLD makes it more visible. Keep your background simple flashy borders, headers, and watermarks are distracting