Tuesday May 13, 2014 Bell Ringer:
60 likes | 183 Vues
In this lesson, students will learn to read and interpret graphs representing real-life motion scenarios. By sketching rough graphs for Fred, Sally, Julia, and Amy's movements, learners will understand how to visualize and analyze rates of change. The focus will be on identifying different types of slopes—steep, gradual, curving up, and curving down—and what they reveal about the motion. This practice aids in developing graphing skills and understanding coordinates in function graphs related to movement.

Tuesday May 13, 2014 Bell Ringer:
E N D
Presentation Transcript
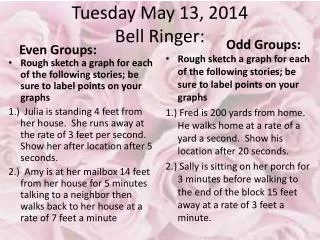
Tuesday May 13, 2014Bell Ringer: Even Groups: Odd Groups: Rough sketch a graph for each of the following stories; be sure to label points on your graphs 1.) Fred is 200 yards from home. He walks home at a rate of a yard a second. Show his location after 20 seconds. 2.) Sally is sitting on her porch for 3 minutes before walking to the end of the block 15 feet away at a rate of 3 feet a minute. • Rough sketch a graph for each of the following stories; be sure to label points on your graphs 1.) Julia is standing 4 feet from her house. She runs away at the rate of 3 feet per second. Show her after location after 5 seconds. 2.) Amy is at her mailbox 14 feet from her house for 5 minutes talking to a neighbor then walks back to her house at a rate of 7 feet a minute
What We are Learning Today: • Reading and understanding the coordinates of function graphs that show a rate of change • Graphing situations that have a rate of change.
What Does a Slope Tell Us About a Rate of Change? • Steep Slope: • Gradual Slope: • Curving Up Slope: • Curving Down Slope:
What Does This Graph Tell Us? (5, 9000) Value (dollars) (0, 3000) Time (years)
Practice Time: • Chapter 2: Lessons 3 & 4