Download
1 / 42
420 likes | 661 Vues
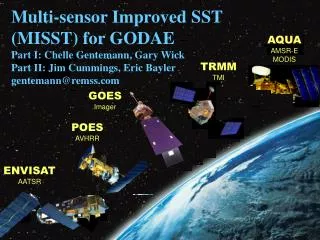
Aqua MODIS Cold FPA Performance and Operation. MODIS Characterization Support Team (MCST). April 25, 2012. Outline. Prior Meeting Summary TEB Introduction Updates on Aqua MODIS performance Key instrument telemetry TEB performance Observed impacts Mitigation Strategies.

E N D
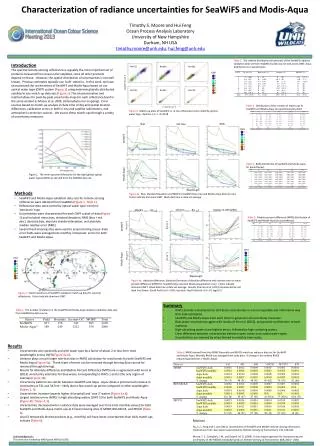
Aqua MODIS Cold FPA Performance and Operation MODIS Characterization Support Team (MCST) April 25, 2012
Outline • Prior Meeting Summary • TEB Introduction • Updates on Aqua MODIS performance • Key instrument telemetry • TEB performance • Observed impacts • Mitigation Strategies
Prior Meeting Summary • MCST held previous workshop in May 7, 2010 • Meeting was held to review the Aqua MODIS CFPA on-orbit performance, provide its possible implications on the L1B product, and give scenarios to stabilize the CFPA operating point. • Aqua MODIS slow loss of cooler margin causing an increase and periodic variations (orbital & seasonal) of CFPA temperatures (up to 0.2K) • Impacts observed • Orbital variation in TEB detector gain • Captured predominantly by the scan-by-scan calibration • Linear relationship between CFPA Temp and TEB detector gain • PC bands more sensitive to CFPA temperatures • Increased fitting residuals from BB WUCD during a0/a2 derivation
Current Status • MCST has continued to monitor telemetry and TEB performance • CFPA temperature continues to increase • CFPA orbital/seasonal oscillation grown larger – max/min difference of ~0.5 K • Radiative cooler margin almost entirely lost. • Majority of impacts on L1B products occur during BB Warmup/Cooldown activities
TEB Calibration Requirements CW: center wavelength in mm; Ttyp: typical scene temperature in K; NEdT: noise equivalent temperature difference in K; UC: uncertainty in percentage (radiance) and in K
TEB Radiometric Calibration EV Radiance: Calibration Coefficients: RVS: Response Versus Scan-angle e: Emissivity L: Spectral band averaged radiance dn: Digital count with background corrected RSR: Relative Spectral Response WUCD TBB: 270 to 315K
MODIS Focal Plane Assemblies (FPA) Warm FPA: VIS and NIR; Cold FPA: SMIR and LWIR
BB Temp Trends Terra 20 mK Aqua 10 mK Weekly average (Cal events excluded)
Instrument & Warm FPA Temperatures Terra ~3.5K increase over 11+ years VIS NIR Aqua ~2K increase over 9+ years VIS NIR Weekly average (Cal events excluded)
Cold FPA Temperatures Terra extremely stable !!! SMIR LWIR Aqua Last CFPA Workshop SMIR LWIR 0.2 K Weekly average (Cal events excluded)
TEB Gain Response PC Bands showing increased variation in b1 1 randomly selected granule per week (good detectors)
Aqua CFPA Heater Voltage 2002 2004 2007 2006 Granule average
Aqua CFPA Heater Voltage 2008 2010 2012 2011 Granule average
Heater Voltage & Duty Cycle Indicates complete loss in control 1 orbit average
Aqua CFPA Oscillations Short Term (1day) trend T SMIR T LWIR Granule average
Aqua CFPA Oscillations Short Term (1day) trend T SMIR T LWIR Granule average
Aqua CFPA Oscillations Long-term trend 0.5 K 0.6 K Solid vertical lines indicate calendar years, dashed vertical line time of last CFPA workshop. Max/Min of 4 orbits, every 8 hours
Observed Impacts • Gain variation with CFPA temperature • captured by scan-by-scan calibration • PC bands show largest effect • Linear relationship between gain and CFPA Temp • BB Warmup-Cooldown Activities • Larger residuals for a2 derivation (a0 = 0 for PC bands) • Bands 33, 35 & 36 TBB Saturation • FPA temperature dependent default b1 algorithm implemented for C6 • Increased instances of EV saturation • Band 27 – Temperature dependent filter bandpassshift • Not included in discussion here
Gain variation with CFPA Temperature T SMIR T LWIR Granule average, top plot: detector 2 for each band
b1 vs CFPA Temp 3 orbits, granule average, detector 2 for each band, normalized by b1 at CFPA = 82.8 K
b1 vs CFPA Temp 3 orbits, granule average, normalized by b1 at CFPA = 82.81 K
BB Warmup/Cooldown • BB Warmup/Cooldown activities • Performed quarterly • Temperature range: 270-315 K • Used for a0/a2 derivation/trending • Bands 33, 35 & 36 saturate for TBB > ~300 K • Default b1 used in L1B • Impact of CFPA Temperature • a0/a2 fitting residuals • Default b1 derivation • EV saturation
BB Warmup/Cooldown 2004/202 2012/035 Fluctuation in CFPA Temp during WUCD influenced detector response to TBB Only bands 31 & 32 relied on the on-orbit derived a2 coefficients – all other bands from pre-launch
Aqua fitting residuals 2006/200 2011/233 Residual Residual TLWIR (K) TLWIR (K)
WUCD a2 trending On-orbit derived coefficients show increased variability (flat line indicates LUT value derived as yearly average)
B33, 35 & 36 Saturation • During WUCD activities bands 33, 35 & 36 saturate for TBB > ~300 K (known issue at launch) • A constant ‘default b1’ used for scan-by-scan calibration during these periods. Tsat for Band 36 is 300K Band 36 b1 for D1, M1; Constant b1 L1B methodology
Default b1 Algorithm Modified for C6 • Revised approach to compensate for CFPA temperature variations • Algorithm details • For each WUCD cycle, select three continuous orbits data (~ 5 hrs) from a previous day. Calculate b1 & TLWIR • Calculate the rate (c1 in percent) of relative b1 change with TLWIR by linear fitting for each detector and mirror side. • Calculate default b1 (b1Tsat) and TLWIR,Tsat using scans with TBBclose to TSAT • For each scan, when TBB > Tsat[Band]: LUT Inputs and Order: b1Tsat = [Band, Detector, Mirror Side] c1 = [Band, Detector, Mirror Side] Tbaseline = [Band], Currently set at 83.0 TLWIR,Tsat = [Band, Mirror Side] TLWIR is the focal plane temperature for each scan and is read from TA_RC_LWIR_CFPAE
Default b1 Algorithm B33 B35 B36
Aqua TEB: C6 default b1 example Black-Body Temperature LWIR FPA Temperature Tsat for Band 36 is 300K Band 36 b1 for D1, M1; Modified default b1 Band 36 b1 for D1, M1; Previous L1B methodology All Data shown are granule averaged
C6 default b1 impact assessment 82.81 K83.26 K Impact will vary depending on CFPA temperature, scene temperature and the value of the ‘current’ default b1. Example shown here indicates the range of difference expected for the 2011/149 WUCD activity. 82.81 K83.26 K 82.81 K83.26 K
EV Saturation • During WUCD when the TBB > Tsat the DCR algorithm is effectively ‘off’ for bands 33, 35 & 36 • DNBB = DNIdeal = 4095 • DN for all other sectors (e.g. Space View) will begin to oscillate with the CFPA temperature due to temperature dependent gain change of detectors. • EV sector will saturate periodically when DNEV + DNSV > DN(Tsat) during the TBB > Tsat scans • No fix possible at L1B level and length of periods with saturated EV will continue to increase in future. • At most 5-6 hours of data lost every 3 months.
EV Saturation: 2006 case (Band 35) DNSV fluctuates with CFPA temp DNBB > DN(Tsat) DCR effectively off
EV Saturation: 2011 case (Band 35) DNSV fluctuation amplitude has increased
EV Saturation: 2012 case (Band 35) DNSV reaches saturation
Saturation Example: Band 36 Tsat is conservatively determined to be 301 K 1 3 4 3 5 5 2 1 6 2 4 6 Black-Body 315 K 302 K 311 K 315 K 313 K 302 K 1 2 3 4 5 6 2012036.1030 2012036.0850 2012036.0945 2012036.1125 2012036.1205 2012036.1300 LWIR Temp. 83.35 K 83.03 K 83.33 K 83.02 K 83.31 K 83.00 K
B36 Saturation Trends • The number of saturated pixels during the WUCD has increased 2004-114 2009-123 2009-123 2011-149 2011-149 2012-036 2012-036 All granules during WUCD
Mitigation Strategies • Scan-by-scan calibration captures much of the impact of the CFPA variation. • CFPA temperature dependent default b1 algorithm implemented in C6 • Options under consideration to address temperature fluctuations the same as previous meeting • No change – continue operations in current configuration • Reduce frequency of WUCD activities • Optional: Flag or do not use B33, 35 & 36 data when TBB > Tsat • Change CFPA set point to 85K • Temporary: Set to 85K for limited period to assess impact before final decision • Permanent: Set to 85K for all future operations • Outgas • Permanent: Set to 83K
IOT Procedures • IOT is prepared & ready to implement the agreed upon solution • For any option involving an operational change the process going forward is identical • Command Authorization Meeting (CAM) at the FOT, approval from at least Mission Director, Flight Systems Manager, Instruments Engineer • Contact request for commanding • Ground Ops prepared and cleared
Option 2 – Change CFPA Set Point to 85K • S/C needs to be in “nominal mode” for this activity • Ensure that CFPA heater B is in the ON state • Send the following commands: SET_RC_CFPA_TEMP TO 1/2/3 MOD_SET_PM_RC_CFPA_TEMP(‘T2’) • Monitor telemetry to ensure that the CFPA temperature adjusts accordingly (real time until it stabilizes) • Concerns: • Majority of pre-launch LUT tables based on 83 K set point • DCR table for 85 K • Loss of dynamic range for TEB • Increased detector noise • Advantages: • Gain stably controlled • EV saturation during WUCD removed
Option 2 Cont’d... MCST has at its disposal the P.L. calibration coefficients for Aqua CFPA @ 85K
Option 3 - Outgas • An outgas without an anomaly requires transitioning MODIS from science mode to standby mode and then to outgas mode • Doors are closed, except SV door is moved to outgas position • This operation/action may require approval from HQ • An outgas requires a set of commands and takes 2-3 days to complete (heaters are turned on in specific sequence) • CFPA will be back to ambient temperature during outgas operation • Potential impact on SWIR (band 6 in particular) detector operability
Discussion • Issues • Actions • Recommendations