Download
1 / 24
240 likes | 441 Vues
ECE 4100/6100 Advanced Computer Architecture Lecture 3 Performance. Prof. Hsien-Hsin Sean Lee School of Electrical and Computer Engineering Georgia Institute of Technology. Performance. Execution/Response time (Latency) Elapsed time between start and completion of an event

E N D
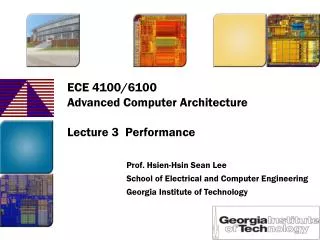
ECE 4100/6100Advanced Computer Architecture Lecture 3 Performance Prof. Hsien-Hsin Sean Lee School of Electrical and Computer Engineering Georgia Institute of Technology
Performance • Execution/Response time (Latency) • Elapsed time between start and completion of an event • How long my job takes? • Throughput (Bandwidth) • Total amount of work done within a given period of time • How many jobs done per unit time on a system?
CPU Performance • Execution Time = Seconds / Program • Microarchitecture • System architecture • Microarchitecture, pipeline depth • Circuit design • Technology • Programmer • Algorithms • ISA • Compilers
1 FO4 Pipeline Stage Combinational Logic F/F F/F P4 pipe stage~ 16 FO4 • Optimal FO4 per pipe • 6 to 8 [UT/Compaq, ISCA-29] • 18 (15+3 latch) [IBM, MICRO-35] Slide from Lecture 1 Pipelining
Architecture Comparison • Many architecture research just make the following assumptions • Instructions / program is fixed • Same binary () • Same compiler () • Same benchmark • Seconds per cycle is constant () • Same frequency • Same pipeline depth • Typically a bad assumption today • Focus on IPC or CPI • It is more complicated for today’s architects !
Example: Calculating CPI Run benchmark and collect workload characterization (simulate, machine counters, or sampling) Base Machine (Reg / Reg) Op Freq Cycles CPI(i) (% Time) ALU 50% 1 .5 (33%) Load 20% 2 .4 (27%) Store 10% 2 .2 (13%) Branch 20% 2 .4 (27%) 1.5 Typical Mix of instruction types in program Design guideline: Make the common case fast MIPS 1% rule: only consider adding an instruction of it is shown to add 1% performance improvement on reasonable benchmarks.
Performance Comparison • For some program running on machine X, PerformanceX = 1 / Execution timeX • "X is n times faster than Y" PerformanceX / PerformanceY = n = speedup of X over Y • Problem: • machine A runs a program in 20 seconds • machine B runs the same program in 25 seconds
Performance Evaluation: Benchmark • (Real) Programs • In the form of collection of programs • E.g., SPEC, Winstone, SYSMARK, 3D Winbench, EEMBC • Kernels: • Small key pieces of real programs • E.g., Livermore Fortran Loops Kernels (LFK), Linpack • Modified (or scripted) • To focus on some particular aspects (e.g. remove I/O, focus on CPU) • (Toy) Benchmarks • Produce expected results • Synthetic Benchmarks: • Representative instruction mix • E.g., Dhrystone, Whetstone • Important for • Architectural and microarchitectural design trade-off • Competitive analysis of real products
Performance Summary Measurement • Average of total execution time • This is Arithmetic Mean (Weighted Arithmetic Mean)
Performance Summary Measurement • Ratei is a function of 1/Timei • Used to represent the average “rate” such as instruction per cycle (IPC)
Why Harmonic Mean? • 30 mph for the first 10 miles • 90 mph for the next 10 miles • Average speed? (30+90)/2 = 60 mph?? • Wrong! • Average speed = total distance / total time • (10+10)/(10/30 + 10/90) = 45 mph
New Breed of Metrics • Performance / Watt • Performance achievable at the same cooling capacity • Performance / Joule (Energy) • Achievable performance at the lifetime of the same energy source (i.e., battery = energy) • Equivalent to reciprocal of energy-delay product (ED product)
Told f (1 - f) Tnew (1 - f) f / P Amdahl’s Law (Law of Diminishing Returns) • Make the common case faster • Speedup = Perfnew / Perfold = Told / Tnew = • Performance improvement from using faster mode is limited by the fraction the faster mode can be applied.
Amdahl’s Law Analogy • Driving from Orlando to Atlanta • 60 miles/hr from Orlando to Macon • 120 miles/hr from Macon to Atlanta • How much time you can save compared against driving all the way at 60 miles/hr from Orlando to Atlanta? • 6hr 45min vs. 7hr 30min = ~11% speedup • Key is to speed up the biggie portion, i.e. speed up frequently executed blocks
1 0.9 0.8 0.7 0.6 Amdahl's Law speed-up as a function of parallelism Code portion in Faster mode (f) 0.5 0.4 0.3 0.2 0.1 P=1 P=2 P=4 P=8 P=32 P=64 P=16 0 1 10 100 Speed-up Parallelism vs. Speedup 1.97x 1.11x 1.33x
Tnew Seq Parallel Told Seq P * Parallel Time Gustafson’s Law • Amdahl’s Law killed massive parallel processing (MPP) • Gustafson came to rescue Assume: Seq + Parallel = 1 (Tnew) Speedup = Seq + p * (1 – Seq) where p=parallel factor If Seq diminishes with increased problem size, Speedup p
Amdahl versus Gustafson Who is right?
The Principle of Locality • Knuth made the original observation about program locality in 1971. • … less than 4 percent of a program generally accounts for more than half of its running time. • 90/10 rule: a program spends 90% of its execution time in only 10% of the code • Two types of locality • Temporal locality (locality in time) • Spatial locality (locality in space) • Memory subsystem design heavily leverages the locality concept for better performance
Example of Performance Evaluation (I) Assume 25% of the ALU ops directly use a loaded operand that is not used again. We propose adding ALU instructions that have one src operand in memory. These new reg-mem instructions spend 2 clock cycles. Also assume that the extended instruction set increase branch’s clock by 1, but no impact to cycle time. Would this change improve performance ?
Example of Performance Evaluation (I) Assume 25% of the ALU ops directly use a loaded operand that is not used again. We propose adding ALU instructions that have one src operand in memory. These new reg-mem instructions spend 2 clock cycles. Also assume that the extended instruction set increase branch’s clock by 1, but no impact to cycle time. Would this change improve performance ?
Example of Performance Evaluation (II) FP instructions = 25% Average CPI of FP instructions = 4.0 Average CPI of other instructions = 1.33 FPSQRT = 2% of all instructions, CPI of FPSQRT = 20 • Design Option 1: decrease the CPI of FQSQRT to 2 • Design Option 2: decease the average CPI of all FP instructions to 2.5
Example of Performance Evaluation (II) FP instructions = 25% Average CPI of FP instructions = 4.0 Average CPI of other instructions = 1.33 FPSQRT = 2% of all instructions, CPI of FPSQRT = 20 • Design Option 1: decrease the CPI of FQSQRT to 2 • Design Option 2: decease the average CPI of all FP instructions to 2.5 Original CPI = 0.25*4 + 1.33*(1-0.25) = 2.0 Option 1 CPI = 2.0 – 2%*(20-2) = 1.64 Option 2 CPI = 0.25*2.5 + 1.33*(1-0.25) = 1.625 Speedup of Option 1 = 2/1.64 = 1.2195 Speedup of Option 2 = 2/1.625 = 1.2308
Example of Performance Evaluation (III) Clock freq = 1.4 GHz FP insturctionss = 25% Average CPI of FP instructions = 4.0 Average CPI of other instructions = 1.33 FPSQRT = 2%, CPI of FPSQRT = 20 • Design Option 1: decrease the CPI of FQSQRT to 2, clock freq = 1.2GHz • Design Option 2: decease the average CPI of all FP instructions to 2.5, clock freq = 1.1 GHz
Example of Performance Evaluation (III) Clock freq = 1.4 GHz FP insturctionss = 25% Average CPI of FP instructions = 4.0 Average CPI of other instructions = 1.33 FPSQRT = 2%, CPI of FPSQRT = 20 • Design Option 1: decrease the CPI of FQSQRT to 2, clock freq = 1.2GHz • Design Option 2: decease the average CPI of all FP instructions to 2.5, clock freq = 1.1 GHz Original CPI = 2.0, IPC = 1/2, Inst/Sec = ½*1.4G = 0.7G inst/s Option 1 CPI = 1.64, IPC = 1/1.64, Inst/Sec = 1/1.64*1.2G = 0.73G inst/s Option 2 CPI = 1.625, IPC = 1/1.625, Inst/Sec = 1/1.625*1.1G = 0.68G inst/s