Download
1 / 2
20 likes | 149 Vues
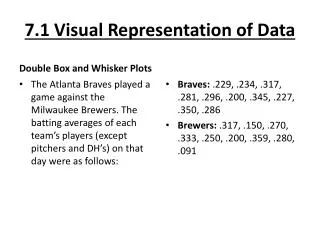
This data visualization highlights the batting averages of players from the Atlanta Braves and Milwaukee Brewers during a specific game, excluding pitchers and designated hitters. Box and whisker plots are utilized to provide a clear visual comparison of the players' performances, showcasing their ranges and interquartile ranges. The Braves' scores are listed as: 229, 234, 317, 281, 296, 200, 345, 227, 350, 286, while the Brewers' scores are: 317, 150, 270, 333, 250, 200, 359, 280, 091. Analysis and worksheets to complete this section can be found on pages 338–339.

E N D
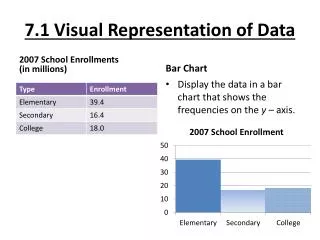
7.1 Visual Representation of Data Double Box and Whisker Plots Braves: .229, .234, .317, .281, .296, .200, .345, .227, .350, .286 Brewers: .317, .150, .270, .333, .250, .200, .359, .280, .091 • The Atlanta Braves played a game against the Milwaukee Brewers. The batting averages of each team’s players (except pitchers and DH’s) on that day were as follows:
7.1 Visual Representation of Data • Worksheet • Problems to complete from 7.1 • Pg. 338 – 339 #24 – 26