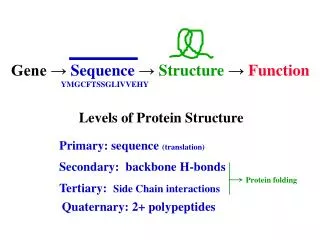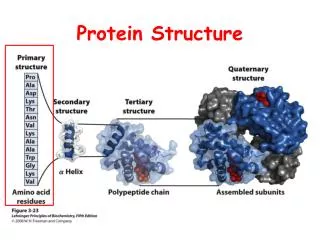
Levels of Protein Structure
390 likes | 1.2k Vues
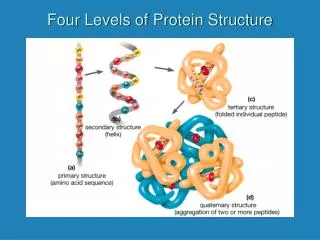
Levels of Protein Structure. Charged and polar R-groups tend to map to protein surfaces. small hydrophobic. large hydrophobic. polar. positive charge. negative charge. DnaG E. coli. ...EPNRLLVVEGYMDVVAL. DnaG S. typ. ...EPQRLLVVEGYMDVVAL. DnaG B. subt. ...KQERAVLFEGFADVYTA.

Levels of Protein Structure
E N D
Presentation Transcript
small hydrophobic large hydrophobic polar positive charge negative charge DnaG E. coli ...EPNRLLVVEGYMDVVAL... DnaG S. typ ...EPQRLLVVEGYMDVVAL... DnaG B. subt ...KQERAVLFEGFADVYTA... gp4 T3 ...GGKKIVVTEGEIDMLTV... gp4 T7 ...GGKKIVVTEGEIDALTV... : : * * * : : : : Primary sequence reveals important clues about a protein • Evolution conserves amino acids that are important to protein structure and function across species. Sequence comparison of multiple “homologs” of a particular protein reveals highly conserved regions that are important for function. • Clusters of conserved residues are called “motifs” -- motifs carry out a particular function or form a particular structure that is important for the conserved protein. motif
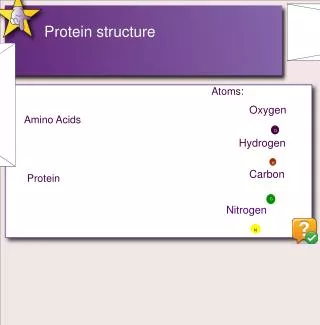
Hydropathy index of amino acids • The hydropathy index of an amino acid is a number representing the hydrophobic or hydrophilic properties of its side-chain. • It was proposed by Jack Kyte and Russell Doolittle in 1982. • The larger the number is, the more hydrophobic the amino acid. The most hydrophobic amino acids are isoleucine (4.5) and valine (4.2). The most hydrophilic ones are arginine (-4.5) and lysine (-3.9). • This is very important in protein structure; hydrophobic amino acids tend to be internal in the protein 3D structure, while hydrophilic amino acids are more commonly found towards the protein surface.
Kyte Doolittle Hydropathy Plot (http://gcat.davidson.edu/DGPB/kd/kyte-doolittle.htm)
Surface region of a protein Window size – 9, strong negative peaks indicate possible surface regions
5-hydroxytryptamine receptor 2A (Grapical output)
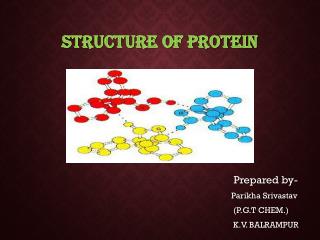
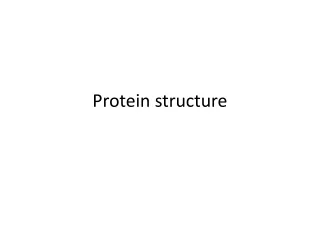
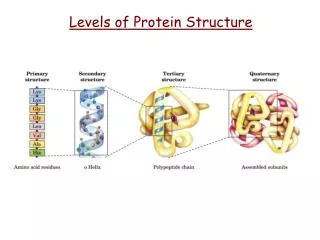
Secondary structure of protein • Amino acid sequences fold onto themselves to become a biologically active molecule. • There are three types of local segments: • Helices: Where protein residues seem to be following the shape • of a spring. The most common are the so-called alpha helices • Extended or Beta-strands: Where residues are in line and successive residues turn back to each other • Random coils: When the amino acid chain is neither helical nor extended
Predicting secondary structure (PSIPRED) (http://bioinf.cs.ucl.ac.uk/psipred)
PSIPRED Continued…
Typical PSIPRED and its explanation • The prediction (Pred) line, consisting of H, E and C characters, denoting the predicted conformation for each residue (H=Helical, E=Extended, and C=Random coil) • The confidence (Conf) line, consisting of digits 9 to 0 indicating the reliability of prediction for each position (9=high, 0=poor)
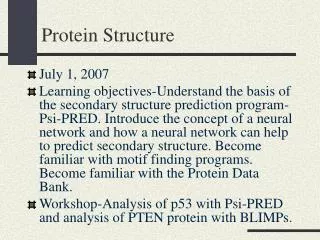
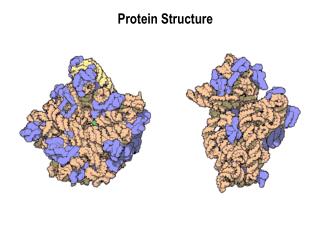
Tertiary structure of protein (http://www.pdb.org/pdb/home/home.do)