Download
1 / 13
130 likes | 232 Vues
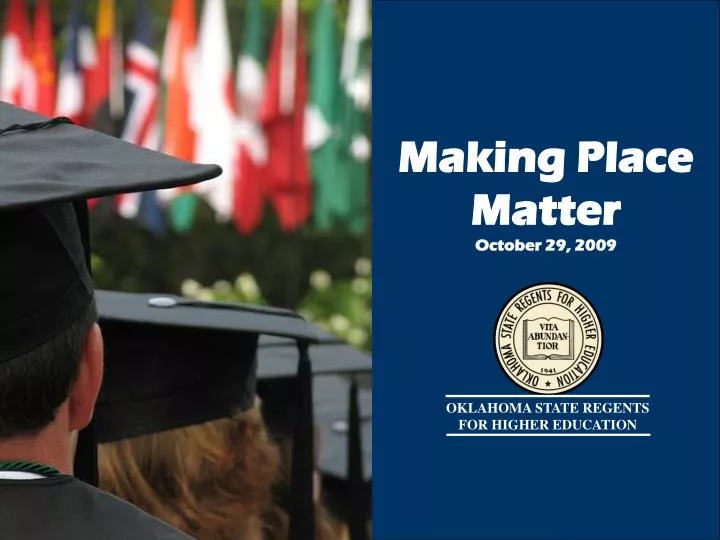
Making Place Matter October 29, 2009. OKLAHOMA STATE REGENTS FOR HIGHER EDUCATION. Last Year’s Successes.

E N D
Making Place Matter October 29, 2009 OKLAHOMA STATE REGENTS FOR HIGHER EDUCATION
Last Year’s Successes BudgetThe total appropriation to higher education resulted in a 3 percent increase over last year’s budget when most agencies in the State Government experienced a 7 percent decrease in their budgets. Stimulus FundingThrough the efforts and advocacy of the higher education community, we were able to recommend $68 million in stimulus funds to offset the proposed State budget reductions of $68 million. 2
Stimulus by the Numbers • Oklahoma received 31% of Education Stabilization Funds; • The national average was 20.7%; • Eleven states received a higher percentage than Oklahoma; • Four of those used all their funds in FY’09 or FY’10 and have no funds left for FY’11 • The remaining 7 states have significant funds left.
Goals for The State System of Higher Education Increase access and improve the quality of public higher education for all Oklahomans Increase the number of college graduates Better prepare students to meet the challenge of a global economy
System Successes • Preliminary Enrollment Report • The Fall 2009 Preliminary Enrollment Report shows that total headcount is up 5.8 percent compared to the same time last year. • A total of 187,676 students have enrolled in classes this fall, 10,291 more than in fall 2008. • Oklahoma’s community colleges experienced the largest percentage increase among the three tiers at 10 percent, or 6,961 students. • Oklahoma’s regional universities saw an overall increase of 5 percent in total headcount.
Enrollment “Oklahoma is now ranked in the Top 10 nationally in thepercentage of students enrolled in public higher education.” Source: Student Data Report Enrollment in Oklahoma Public Colleges and Universities Seven Year Trend 250,000 240,000 238,245 235,730 234,873 233,203 228,249 230000 220,768 220,000 213,972 210,000 200,000 2000- 01 2001- 02 2002- 03 2003- 04 2004- 05 2005- 06 2006- 07
26% Degrees Conferred by Oklahoma Public Colleges and Universities Source: Brain Gain Report In 2007-08, State System institutions awarded a total of 23,974 associate and bachelor’s degrees – the most awarded in a single year in state history 23,974 23,962 23,689 22,908 21,877 Number of Associate and Bachelor’s Degrees Conferred 20,714 This is 26 percent more degrees awarded than in 2000-2001. 19,611 19,021 2000-01 2001-02 2002-03 2003-04 2004-05 2005-06 2006-07 2007-08
System Successes What percentage of Oklahoma residents and non-Oklahoma residents who graduate from public colleges and universities remain in Oklahoma?
Doctoral Certificate Professional Doctoral Professional Associates Associates Bachelor’s Bachelor’s Certificate Master’s Master’s Employment Outcomes After One Year All System Graduates Source: 2008 Employment Outcomes Report 100% 90% 80% Percent of Graduates Employed In State After One Year 70% 60% 50% 40% 2002-03 2005-06
$ COST SAVINGS • Oklahoma institutions of higher education have implemented and developed cost savings initiatives that will have a total annual savings of $46.2 million once fully implemented. • Cost saving initiatives focus primarily on the following programs; • Alternative Energy Sources – Wind Energy at OU and CNG at OSU • Energy Saving Programs through performance contracts • FTE reduction through attrition • Flexible work schedules in summer months (four day work week) • Reduction in gasoline consumption with institutional vehicles • Increase in use of distance learning • Technology via OneNet 11
System EfficienciesTotal System Administrative Costs FY92-FY09 $ 14% 11.9% 12% 11.1% 10% 9.3% 8.3% 8.2% 8.2% 8.1% 8.1% 7.9% 8% 7.8% System Admin Costs as a Percent of Total Budget 6% 4% 2% 0% FY06 FY92 FY94 FY96 FY98 FY00 FY04 FY08 FY09 FY02
Economic Impact • For every state appropriated dollar spent on higher education in Oklahoma an additional $5.15 is pumped into the Oklahoma economy. • In 2008 Oklahoma’s system of higher education will produce over $3.2 billion in growth in the state’s gross domestic product; • In 2008 higher education’s capital and construction spending are expected to add 23,750 jobs to the Oklahoma economy; • By the end of the next decade, Oklahoma’s gross state product (GSP) will increase by $26.292 billion through higher education’s continued contribution to the economy;
BudgetThe total appropriation to higher education resulted in a 3 percent increase over last year’s budget when most agencies in the State Government experienced a 7 percent decrease in their budgets. Making Place Matter 3