Download
1 / 42
420 likes | 544 Vues
Natural Water Chemistry. Water Quality Parameters. Temperature - Dissolved Oxygen (DO) - pH Alkalinity - Hardness Nitrates and Phosphates - Turbidity Conductivity -. Temperature. Affects: Water density Gas solubility Chemical reaction rates Organism growth rates

E N D
Water Quality Parameters • Temperature - Dissolved Oxygen (DO) - pH • Alkalinity - Hardness • Nitrates and Phosphates - Turbidity • Conductivity • -
Temperature Affects: Water density Gas solubility Chemical reaction rates Organism growth rates Conductivity pH Dissolved Oxygen
Temperature – naturally variesbecause of… … Changes in seasonal/diurnal air temperature … Thermal stratification in lakes … Size and temperature of inflows … Residence time (lakes)
Temperature – artificially variesbecause of… … Heated industrial effluent … Runoff from asphalt/pavement … Deforestation
Q10 rule cold-blooded aquatic organisms poikilothermic = cold blooded Predicts that growth rate will double if temperature increases by 10˚C (18˚F) within their "preferred" range.
Dissolved Oxygen (DO) DO is the measurement of oxygen dissolved in water and available for fish and other aquatic life. Indicates health of an aquatic system. Can range from 0-18 ppm. Most natural water systems require 5-6 ppm to support a diverse population. Varies with time of day, weather, temperature.
Increase in organic waste Increase in algae/plant vegetation Decrease in DO available to organisms Leads to changes in ecosystem as organisms needing lots of DO are replaced by organisms needing little. Dissolved Oxygen (DO)
Hood Canal, Wash. DO Part of Puget sound. Fed by snowmelt from Olympic Mountains. Used for wildlife habitat, outdoor recreation, fisheries, home to two tribal nations. Health of water threatened by decrease in DO – work underway by member of Hood Canal DO Project to try to find out why. Hood Canal
“Sill” reduces flow. Inflow from main entrance salt water, runoff fresh. The freshwater carries natural stuff: fall leaves, winter run-off, salmon carcasses Non natural stuff: yard waste, storm-water toxins, herbicide residue, effluents from septic tanks and sewers Increase in organics leads to decrease in DO – this changes the ecosystem, as anoxia-loving critters take over as the O2-loving animals become choked out. Affects bottom first – bottom feeders will rise to top if they can (eg: rockfish, deep-sea shrimp), but others can’t (sea cucumbers, anemone, starfish)…so they perish. Sill
Potential causes • Natural • increased sunlight or other climate factors • increased nutrient availability • Changes in ocean properties • Changes in river input (e.g.: drought) • Changes in weather conditions • Artificial • human loading of nutrients or organic material • Changes in river input (eg: diversion)
pH - p(otential of) H(ydrogen) pH = -log [ H +] Determines the solubility of nutrients (PO4-3, NO3-, C) and heavy metals (Fe, Cu, etc) Determines availability of these chemicals for use by aquatic life. In natural water systems, determined largely by geology and soils.
Sea water due to humic acid Limestone, marble, CO3 rich Pure rain, snow pH of natural waters Modified from www.waterwatch.org http://www.vic.waterwatch.org.au/fortheteacher/manual/sect4f.htm
Factors that affect pH • Algal blooms • Bacterial activity • Water turbulence • Chemicals flowing into the water body • Sewage overflows • Pollution
How pH affects aquatic life Decreasing pH (e.g.: via acid rain) ▼ Liberation of Al, metals ▼ Toxic conditions ▼ Chronic stress ▼ Smaller, weaker fish
Alkalinity Alkalinity refers to the capability of water to neutralize acid. Buffering capacity – resistance to pH changes. Common natural buffer: CO3 (carbonates – like limestone). Protects aquatic life. Commonly linked to water hardness. In natural systems: 50 – 150 mg/L as CaCO3. Limestone outcrop
Hardness Reflects dissolved carbonate minerals. Mostly of concern for drinking water standards. Metals precipitate out of solution. Create scale/hard water deposits High alkalinity Hard water From USGS http://water.usgs.gov/owq/news.html
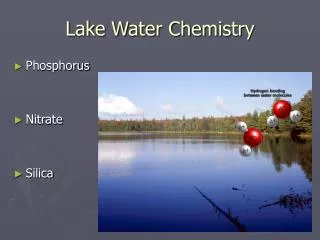
Nitrates and Phosphates Nitrate (NO3-) naturally-occurring form of nitrogen found in soil. Forms by microbial decomposition of fertilizers, plants, manures or other organic residues Plants uptake nitrates (Spinach a good source). Phosphate (PO4-3) naturally occurs in rocks and minerals. Plants uptake weathered-out elements and compounds. Animals ingest plants. Water soluble. Redfield Ratio: 106:16:1
Nitrates • Artificial sources: • Livestock • manure/urine • Failing septic • systems • Synthetic fertilizers • Can lead to: • eutrophication of natural water systems (overproduction of vegetation) • Blue baby syndromne The U.S. EPA has set a maximum contaminant level for NO3- in drinking water of 10 parts per million (ppm)
Phosphates • Artificial sources: • Sewage • Laundry, cleaning fluids • Synthetic fertilizers • Can also lead to eutrophication of natural water systems (overproduction of vegetation) Blue green algae
1990 and 1999 comparison of Nitrates in Great Lakes From US EPA http://www.epa.gov/glnpo/monitoring/limnology/SprNOx.html
Hypoxia in the Gulf of Mexico Hypoxia – decreased oxygen Colored areas are Key Farming States = The Corn Belt. Many have drained 80% of Wetlands Increased Fertilization flows from Mississippi River to the Gulf Gulf of Mexico Mississippi River drainage basin – 41% of US landmass.
Hypoxia in the Gulf of Mexico 1.6 million tons Of nitrogen now enter the Gulf from the Mississippi basin Hypoxic waters Image from Jacques Descloitres, MODIS Land Rapid Response Team, NASA/GSFC, January 2003
Hypoxia in the Gulf of Mexico Particularly bad for fish because coastal areas is spawning grounds before moving to deeper waters. From NCAT (Nat’l Center for Appropriate Technology) http://www.ncat.org/nutrients/hypoxia/hypoxia.html
Global distribution of oxygen-depleted coastal zones. The 146 zones shown are associated with either major population concentrations or with watersheds that deliver large quantities of nutrients to coastal waters.
Source: Patrick Heffer, Short Term Prospects for World Agriculture and Fertilizer Demand 2002/03 - 2003/04 (Paris: International Fertilizer Industry Association (IFA), December 2003); IFA Secretariat and IFA Fertilizer Demand Working Group, Fertilizer Consumption Report (Brussels: December 2001); historical data from Worldwatch Institute, Signposts 2002, CD-ROM, compiled from IFA and the U.N. Food and Agriculture Organization, Fertilizer Yearbook (Rome: various years).
Solutions?? Wetland restoration Reduce fertilizers Reduce soil erosion Reduce emissions – WWTP/industry
Turbidity Measures how “murky” the water is Estimates: Mineral fraction Organics Inorganics Soluble organic compounds Plankton Microscopic organisms MODIS Image from NASA http://rapidfire.sci.gsfc.nasa.gov/
Turbid Causes of highly waters • In open waters, phytoplankton • Closer to shore, Mining Resuspended bottom sediments (wind) • Organic debris from stream Increased flow rates • Floods • Too many bottom-feeding fish (such as carp) • Hippos
Turbid Effects of highly waters • Modify light penetration • Increase sedimentation rate • Smother benthic habitats • Settling clay particles can suffocate • newly hatched larvae • Fine particulate material also can • damage sensitive gill structures • Decrease organism resistance to disease • Prevent proper egg and larval development • Macrophyte growth may be decreased • Reduced photosynthesis can lead to lower daytime release of oxygen
From waterontheweb.org http://waterontheweb.org/under/waterquality/turbidity.html
Na+ Na+ Na+ Na+ Na+ Na+ Na+ Na+ Na+ Na+ Na+ Na+ Na+ Na+ Na+ Na+ Na+ Na+ Na+ Na+ Na+ Conductivity Ability of a substance to conduct an electrical current. In water, conductivity determined by types and quantities of dissolved solids. (Commonly called Total Dissolved Solids = TDS) Current carried by ions (negatively or positively charged particles). Eg: NaCl(aq) = Na + + Cl – Cl- Cl- Cl- Cl- Cl- Na+ Na+ Na+ Na+ Cl- Cl- Cl- Cl- Cl- Na+ Na+ Cl- Cl- Cl- Cl- Cl- Na+ Na+ Cl- Cl- Cl- Cl- Na+ Cl- Na+ Na+ Na+ Cl-
Conductivity Conductivity of natural waters depends upon: Ion characteristics (mobility, valence, concentration) More ions = more conductive Water temperature Geology – soil Size of watershed Evaporation – such as in Salt Lakes Some artificial factors that can affect conductivity: Wastewater Urban runoff (especially road salt) Agricultural runoff
Electrical Conductivity and TDS From wateronthweb.org http://www.waterontheweb.org/under/waterquality/conductivity.html Salt present in 1L water