Expression Data and Microarrays
Expression Data and Microarrays. CMMB November 29, 2001 Todd Scheetz. Overview. Gene expression mRNA protein Northern Blots RT-PCR SAGE MicroArray. Gene Expression Review. Transcription generation of mRNA from genomic DNA a complete copy is made, including both introns and exons.

Expression Data and Microarrays
E N D
Presentation Transcript
Expression Data and Microarrays CMMB November 29, 2001 Todd Scheetz
Overview Gene expression • mRNA • protein Northern Blots RT-PCR SAGE MicroArray
Gene Expression Review Transcription • generation of mRNA from genomic DNA a complete copy is made, including both introns and exons. pre-mRNA genomic AAAA... pre-mRNA
Gene Expression Review Processing / Splicing • removal of the introns from the pre-mRNA mature mRNA • also exported from the nucleus to the cytoplasm • alternative splicing AAAA... pre-mRNA AAAA... mature mRNAs (splice variants) AAAA...
Gene Expression Review Translation • takes an mRNA molecule and uses it to construct an amino acid sequence. • the ribosome is the underlying machinery used in the process of translation.
Measuring Gene Expression Two major differentiating factors… Quantitative vs. Qualitative mRNA vs protein Most techniques can be used to determine quantitative expression levels. Ex. EST sequencing
Measuring Gene Expression More sophisticated experiments… Comparing expression levels of multiple genes Comparing co-regulation or differential regulation. Ex. EST sequencing
Northern Blot Measure relative expression levels of mRNA 1. mRNA isolation and purification 2. electrophorese on a gel 3. The gel is probed by hybridizing with a labeled clone for the gene under study.
RT-PCR Measures relative expression of mRNA 1. Isolate and purify mRNA 2. reverse transcription 3. PCR amplification 4. run on gel and probe/hybridize
RT-PCR Why use RT? Can observe very low levels of expression Requires very small amounts of mRNA The bad… Potential expression-level skew due to non-linearity of PCR Have to design multiple custom primers for each gene.
SAGE Tags are isolated and concatermized. Relative expression levels can be compared between cells in different states.
SAGE --gene to tag mapping http://www.ncbi.nlm.nih.gov/SAGE/SAGEcid.cgi?cid=28726
MicroArray What are they? allow 1000’s of expression analyses to be performed concurrently. What technologies are used? How to analyze the image? How to analyze the expression data? What bioinformatics challenges are there?
Potential Microarray Applications • Drug discovery / toxicology studies • Mutation/polymorphism detection Differing expression of genes over: • Time • Tissues • Disease States • Sub-typing complex genetic diseases
Glass Microarray 326 Rat Heart Genes, 2x spotting
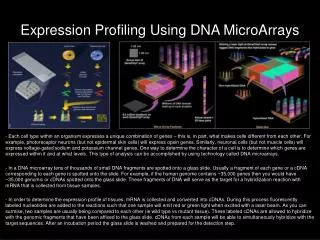
MicroArray Overview of data capture two different mRNA populations, labeled with different fluors excited by a laser each fluour excites at a different wavelength, which is captured using a photodetector attached to a filter tuned to the particular fluor
MicroArray Overview of image analysis spot identification grid alignment skew image normalization variable background uneven hybridization
Image Analysis/Data Quantization • Feature (target probe) segmentation • Data extraction and quantization of: • Background • Feature • Correlation of feature identity and location within image • Display of pseudo-color image
Microarray Experiment Design • Type I: (n = 2) • How is this gene expressed in target 1 as compared to target 2? • Which genes show up/down regulation between the two targets? • Type II: (n > 2) • How does the expression of gene A vary over time, tissues, or treatments? • Do any of the expression profiles exhibit similar patterns of expression?
Motivation & Design Constraints • Probe set design involves the prioritizing and parsing of an initial data set containing potentially hundreds of thousands of probe candidates to define a reasonably sized set for use in a microarray experiment • A single hybridization can produce several thousand data tuples, each containing multiple (n>10) measurements • No “All-in-one” software package is currently available, therefore, communication of data between the packages must be facilitated by the pipeline
Probe Set Design • Goal of probe set design is to identify a reasonably sized subset of probes from a much larger starting set from a variety of sources • By defining a set of criteria, an investigator should be able to create new probe sets or refine existing sets • Pruning a data set should be done in several stages: • Use readily available information to limit scope of data • Obtain more information about remaining probes • Narrow focus based on additional information • Iterate until desired data set is obtained
1° -- Direct Species Tissue Chromosome Sequence Available Quality Tail/Poly(A) signal Map position known? Cluster size 2° -- Indirect Blast results Confidence value Homology (or lack of) Annotation contains words like “transfer” 3’ & 5’ EST reads hit same gene Syntenic Map Information Known phenotypes in other species Sample Probe Set Design Criteria
cDNA Microarray Slide Creation • cDNA clones defining a probe set must be re-arrayed from their sources (e.g. local storage or commercial) into a format suitable for amplification and printing (e.g. 96-well microtiter plates) • Based on the size of the probe set and the limitations of the printer, a parameter set (# of pens, spot spacing, grid dimensions,…) must be defined for printing the probe set onto the slide(s) • A mapping operation must be performed in order to track each probe from source to destination in order to correlate known information with a particular “spot” in a microarray image
MicroArray Overview of data analysis vs. time vs. other genes co-reg. diff. reg pathway ident.
Data Analysis • Data analysis consists of several post-quantization steps: • Statistics/Metrics Calculations • Scaling/Normalization of the Data • Differential Expression • Coordinated Gene Expression (aka clustering) • Most software packages perform only a limited number of analysis tasks • Databases can facilitate the movement of data between packages
Scaling and/or Normalization • Positive Controls • ‘Spiked’ DNA • Housekeeping Genes • Total Array • Negative Controls • Foreign DNA • ‘Empty’ spots
Scaling and/or Normalization • Linear regression • Log-linear regression • Ratio statistics • Log(ratio) mean/median centering • Nonlinear regression
MicroArray Bioinformatics challenges 1. data management 2. utilizing data from multiple experiments (type II) 3. utilizing data from multiple groups * with different technologies * with only processed data available
3’ … A C G G G C … … ATG … 5’ 3’ … A C G G G A … … ATG … 5’ 3’ … A C G G G C … … ATG … 5’ Condition1 2 3 4 Expression Level + - + + - - + + - - - + + - - + - ? Gene A B C E D 0 60 120 180Time Database(s) Local Alignment A Expression Level - 0 + C B 1 2 3 4Timepoints Search Window
MicroArray data management clone - spot clone - gene raw expression level normalized expression level annotation/links expression profile
MArray Expt Mgmt Redux Experiment 5-Tuple: (Probe Set_ID, Target_ID, Hyb Condition_ID, Hyb Iteration_ID, GenePix_Analysis_ID)
Database Support (EBI Schema) http://www.ebi.ac.uk/arrayexpress/ http://www.bioinf.man.ac.uk/microarray/maxd
Differential Expression • Type I analysis • Look for genes with vastly different expression under different conditions • How do you measure “vastly different”? • What role should derived statistics play?
Coordinated Gene Expression • Type II analysis • “Eisen”ized data (dendrograms) • Self-Organizing Maps • Principal Component Analysis • k-means Clustering