Download
1 / 1
10 likes | 180 Vues
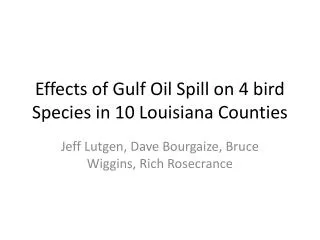
Precipitation Effects on Winter Bird Species Utilizing Christmas Bird Counts Isaac Morgan, Elizabeth Tanner, Jeff Monroe, Jason Behrends University of Wisconsin- Platteville Biology Department. Conclusions. Introduction. Results.

E N D
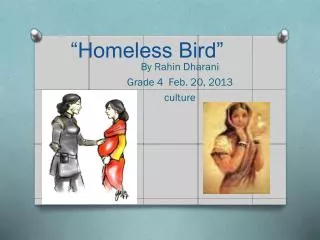
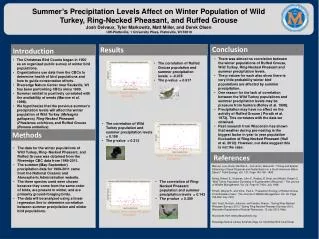
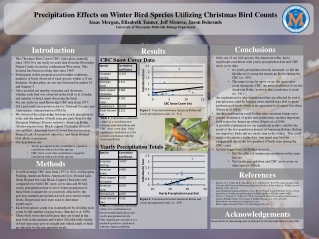
Precipitation Effects on Winter Bird Species Utilizing Christmas Bird Counts Isaac Morgan, Elizabeth Tanner, Jeff Monroe, Jason BehrendsUniversity of Wisconsin- Platteville Biology Department Conclusions Introduction Results • Only one of our bird species, the American robin, had a significant correlation with yearly precipitation data and CBC snow cover data. • As yearly precipitation levels increased, so did the likelihood of seeing the American Robin during the CBC (r= .459). • The same is true for snow cover, the more snow cover during the CBC, the more likelihood of see the American Robin, however this correlation is weak (r= .311). • An explanation for why American robins are affected by yearly precipitation could be because more rainfall may lead to more production of seeds which is an important food source for robins (Howe et al 1982). • Another explanation could be that more moisture brings out a greater abundance of grubs and earthworms, another important food source for American robins (Duriezet al 2006). • A possible explanation for our significant results could be the result of the low population density of American Robins. Robins are migratory birds and are rarely seen in the winter. This could cause a discrepancy in the data. Any trend may be over exaggerated due to the low numbers of birds seen during the CBC count. • Several suggestions for further research… • Test the effect of summer precipitation on the same species. • Test yearly precipitation and CBC snow cover on other species of birds. • The Christmas Bird Count (CBC) takes place annually since 1900. For our study we used data from the Riveredge Nature Center located in southeastern Wisconsin. This location has been recording data since 1969. • Participants in this program record weather conditions, numbers of birds observed of each species within a 15 mi diameter. It takes place on one day between December 14 and January 5. • Also recorded are number of parties and observers, whether each bird was observed in the field or at a feeder, and number of hours spent observing the birds • For our study we used Riveredge CBC data from 1977-2011 and yearly precipitation data by National Oceanic and Atmospheric Administration (NOAA). • We observed the relationship between yearly precipitation totals and the number of birds seen per party hour for the European Starling (Sturnusvulgaris), American Robin (Turdusmigratorius), Black-capped Chickadee (Poecileatricapillus), American Crow (Corvusbrachyrhynchos), Horned Lark (Eremophilaalpestris), and Great Horned Owl (Bubo virginianus). • Our hypotheses are: • Yearly precipitation data would have a positive correlation with each of the species. • CBC snow cover data would have a negative correlation with each of the species. CBC Snow Cover Data Figure 1: Correlation between American Robin and yearly precipitation totals. (r= .311) Table 1: Correlation coefficient values of a correlation test between individuals/hour and CBC snow cover data. Only significant correlation is a low positive correlation with the American Robin Yearly Precipitation Totals Methods • Used Riveredge CBC data from 1977 to 2011 on European Starling, American Robin, American Crow, Horned Lark, Great Horned Owl and Black-Capped Chickadee and compared it to both CBC snow cover data and NOAA yearly precipitation data to see if winter population of these birds is negatively or positively affected by the previous summer precipitation levels and current winter levels. Regression tests were used to determine significance. • Each bird species count was standardized by dividing each count by the number of party hours (Butcher et al 1990). • These birds were chosen because they are found in the area both in the summer and winter. Also the wide variety of bird types may give us insight into which kinds of birds are affected by the precipitation levels. References • Butcher, G. S., Fuller, M. R., McAllister, L. S., & Geissler, P. H. (1990). An Evaluation of the Christmas Bird Count for Monitoring Population Trends of Selected Species. Wildlife Society Bulletin, 18(2), 129-134. • Daily Hydrometeorological Products. (n.d.). Retrieved from National Weather Service website: http://forecast.weather.gov/product.php?site=MKX&product=HYD&issuedby=MKX • Duriez, O., Ferrand, Y., & Binet, F. (2006). An Adapted Method for Sampling Earthworms at Night in Wildlife Studies. The Journal of Wildlife Management, 70(3), 852-858. • Robin Photo: www.themississagilighthouse.com • Black-capped Chickadee Photo: www.hdwallpapersfan.com Figure 2: Correlation between American Robin and yearly precipitation totals. (r= .459) Table 2: Correlation coefficient values of a correlation test between individuals/hour and yearly precipitation levels. Only significant correlation is a moderate positive correlation with the American Robin. Acknowledgements We would like to acknowledge past contributors to the Riveredge Nature Center CBC.