Probabilities from two way tables
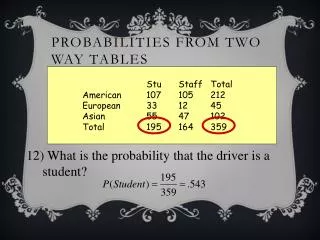
Probabilities from two way tables. Stu Staff Total American 107 105 212 European 33 12 45 Asian 55 47 102 Total 195 164 359 . 12) What is the probability that the driver is a student?. Probabilities from two way tables. Stu Staff Total American 107 105 212

Probabilities from two way tables
E N D
Presentation Transcript
Probabilities from two way tables Stu Staff Total American 107 105 212 European 33 12 45 Asian 55 47 102 Total 195 164 359 12) What is the probability that the driver is a student?
Probabilities from two way tables Stu Staff Total American 107 105 212 European 33 12 45 Asian 55 47 102 Total 195 164 359 13) What is the probability that the driver drives a European car?
Probabilities from two way tables Stu Staff Total American 107 105 212 European 33 12 45 Asian 55 47 102 Total 195 164 359 14) What is the probability that the driver is staff and drives an Asian car?
Probabilities from two way tables Stu Staff Total American 107 105 212 European 33 12 45 Asian 55 47 102 Total 195 164 359 15) What is the probability that the driver drives an American or Asian car? Disjoint?
Probabilities from two way tables Stu Staff Total American 107 105 212 European 33 12 45 Asian 55 47 102 Total 195 164 359 16) What is the probability that the driver is staff or drives an Asian car? Disjoint?
Probabilities from two way tables Stu Staff Total American 107 105 212 European 33 12 45 Asian 55 47 102 Total 195 164 359 17) If the driver is a student, what is the probability that they drive an American car? Condition
Probabilities from two way tables Stu Staff Total American 107 105 212 European 33 12 45 Asian 55 47 102 Total 195 164 359 18) What is the probability that the driver is a student if the driver drives a European car? Condition
Example 19: Management has determined that customers return 12% of the items assembled by inexperienced employees, whereas only 3% of the items assembled by experienced employees are returned. Due to turnover and absenteeism at an assembly plant, inexperienced employees assemble 20% of the items. Construct a tree diagram or a chart for this data.
Example 19: Management has determined that customers return 12% of the items assembled by inexperienced employees, whereas only 3% of the items assembled by experienced employees are returned. Due to turnover and absenteeism at an assembly plant, inexperienced employees assemble 20% of the items. Construct a tree diagram or a chart for this data. What is the probability that an item is returned? If an item is returned, what is the probability that an inexperienced employee assembled it? P(returned) = 4.8/100 = 0.048 P(inexperienced|returned) = 2.4/4.8 = 0.5
Only 5% of male high school basketball, baseball, and football players go on to play at the college level. Of these, only 1.7% enters major league professional sports. Of the athletes that do not play college sports, only 0.1% enters major league professional sports. What is the probability that a high school athlete will play professional sports? What is the probability that a high school athlete does not play college sports if he plays professional sports? 1.7% of 50 Make up a population size! 5% of 1000 P(play pro) = P(play college & Play pro) or P(not play college & play pro) = .05(.017) + (.95)(.001) = .0018 P(not play college | plays pro) = P(not play college & play pro) / P(play pro) = .95/1.8 = .5278
People leaving a football match were asked if they supported Manchester United or Newcastle.They were also asked if they were happy. The probability supporting Manchester United is .46. The probability that they support Manchester United and are unhappy is .29. The probability that they support Newcastle and are happy is .33. 170 330 500 290 500 210 460 1000 540