Exploring Income Predictions and Superpower Preferences Among Young Adults
This analysis delves into the perceptions of young adults (ages 19-25) regarding their chances of achieving a middle-class income by age 30, based on a survey of 4,826 participants. It compares responses between genders, revealing men are generally more optimistic than women about their future financial success. Additionally, the study examines preferences for superpowers among 415 children from the US and Canada, highlighting significant associations between demographic factors and chosen abilities. The findings emphasize the importance of analyzing categorical variables through visual representations like bar charts.


Exploring Income Predictions and Superpower Preferences Among Young Adults
E N D
Presentation Transcript
Two way tables Marginal distributions
Bar charts… revisited • Bar charts are sometimes referred to as one way tables. They show data for single categorical data. • What do we do when a data set involves two categorical variables?
Gonna be rich? • A survey of 4826 random young adults (19-25) asked “What do you think the chances are that you will have more than a middle-class income at age 30? Gender
Gonna be rich? • Percents are more useful than counts when comparing groups. • Response Percent Almost no chance 194/4826= 4% Some chance 712/4826=14.8% 50-50 chance 1416/4826= 29.3% A good chance 1421/4826= 29.4% Almost certain 1083/4826=22.4%
Gonna be rich? • Based on the survey data, can we conclude that young men and women differ in their opinions about the likelihood of future wealth? • Make a side-by side (or stacked) bar graph
Gonna be rich? • My analysis: • Based on the sample data, men seem somewhat more optimistic about their future income than women. Men were less likely to say that they have “some chance but probably not” than women (11.6% vs 18.0%). Men were more likely to say that they have a “good chance” (30.8% vs 28%) or are “almost certain” (24.3% vs 20.5%) to have more than a middle-class income by age 30.
Gonna be rich? • Definition: Association • We say there is an association between two variables if knowing the value of one variable helps to predict/analyze the value of the other. • Can we say the “rich opinion” data shows association? (can we approximate?) * Think law of complements*
Gonna be rich? • A conditional distribution is a distribution for a sub-population. • Calculate the conditional distribution of opinions among young men.
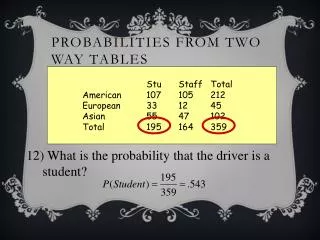
What’s your superpower? • 415 children were surveyed from the U.S. and Canada about what super power they would choose. The results are below: • A) calculate the marginal distributions (in %) • B) Make a graph to display the marginal distribution and describe what you see. • C) Is there association? Site evidence
What’s your superpower? • A) Answers: fly=23.9%, Freeze time=23.1%, Invisibility=16.1%, Superstrength=10.4%, telepathy=26.5% • B) graphs will vary- I suggest bar graph. It appears that telepathy, flying, and freeze time were the most popular choices with approximately 25% of students choosing each one. Invisibility was the 4th most popular with strength as the least popular in this survey. • C) There is an association between country of origin and superpower preference. Students in Canada are more likely to choose flying and freezing while students in the U.S. are more likely to choose invisibility or telepathy. Superstrength is equally unpopular in both countries.