Download
1 / 40
400 likes | 536 Vues
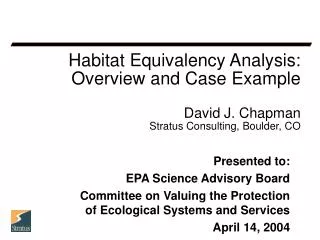
Habitat Equivalency Analysis: Overview and Case Example David J. Chapman Stratus Consulting, Boulder, CO. Presented to: EPA Science Advisory Board Committee on Valuing the Protection of Ecological Systems and Services April 14, 2004. HEA Overview. Scaling objectives and methodologies

E N D
Habitat Equivalency Analysis: Overview and Case ExampleDavid J. ChapmanStratus Consulting, Boulder, CO Presented to: EPA Science Advisory Board Committee on Valuing the Protection of Ecological Systems and Services April 14, 2004
HEA Overview • Scaling objectives and methodologies • Habitat Equivalency Analysis: a scaling strategy • When to consider use of HEA • Basic steps in applying this approach • Example
Origination of HEA • HEA developed in the Natural Resource Damage Assessment arena • Purpose on NRDA: Make the public whole for injuries to natural resources that result from the release of hazardous substances or oil • The public is made whole through “restoration” (damages recovered must be used for restoration) • NRDA restoration complements, but is distinct from, “cleanup” actions
Concepts of Compensation and Scaling Approaches • CERCLA: • Monetary Compensation: Value-to-cost scaling • How much money do the affected individuals require to be "made whole" for the loss? • OPA: • Resource compensation-primary measure: • How much additional public resources does the public require to be "made whole" for the loss? • Service-to-service/Resource-to-Resource scaling • Value-to-value scaling • Value-to-cost scaling
Resource Compensation Equation where t refers to time (in years): t = 0, the injury occurs; t = B, the injured habitat recovers to baseline; t = C, time the claim is presented; t = I, habitat replacement project begins to provide services; t = L, habitat replacement project stops yielding services is the annualized per unit value of the services provided by the injured habitat (without injury) is the annualized per unit value of the services provided by the replacement habitat is the level of services per unit provided by the injured habitat at the end of year t is the baseline (without injury) level of services per unit of the injured habitat is the level of services per acre provided by the replacement habitat at the end of year t is the initial level of services per unit of the replacement habitat t is the discount factor, where t = 1/(1+r)t-C, and r is the discount rate for the time period J is the number of injured units P is the size in acres of the replacement project that equates the losses with the gains from restoration.
Methods for Scaling Restoration • Expedited Methods • Type A • Benefits Transfer • Service-to-Service / Resource-to-Resource Approach • Habitat Equivalency • Value-to-Value Approach • Travel Cost • Stated Choice Method/Contingent Valuation/Conjoint • Factor Income
Habitat Equivalency Analysis • Framework: • Addresses interim lost services • Resources/Service losses due to injury = Resource/service gains from compensatory restoration project • Obtain equivalency between the resources/services lost and those gained through restoration • Conditions for use: • Injured and restored resources and services are the same type, quality, and comparablevalue • Comparable value is a strong assumption
Interim losses Baseline Recovery path with primary restoration Incident date Start primary restoration Definition of Interim Losses Resource Service Level Natural recovery path Time
Habitat Equivalency Analysis: General Principles • Calculates compensation for interim lost services, with habitat/resource replacement as the form of compensation • Calculates the amount of habitat/resource to be created or enhanced to provide the same level of services over time as were lost due to the injury • Requires implicit assumption that the values per unit of lost services and replacement services are comparable • HEA simultaneously determines injury quantification and restoration scaling in one method
“Debit: PDV Loss” “Credit: PDV Gain” where: L = lost services at time t t R = replacement services at time s s t = ti me when lost services are first suffered 0 t = time when lost services are last suffered l s = time when replacement services are first provided 0 s = time when replacement services are last provided l P = present time when the natural resource damage claim is presented i = periodic discount rate. HEA - Equation
Brief History of Habitat Equivalency Analysis • Assessment approach originally developed in 1992 to quantify damages associated with contaminated wetlands • Has since been applied to cover injuries due to chronic contamination, spills and vessel groundings in a variety of habitats • Currently the approach most commonly used by trustees for assessing natural resource damages • Gained wide acceptance with PRP community • Supported in Salvors, Great Lakes Dock and Dredge court decisions
When to Consider Use of HEA • When values per unit of replacement services and lost services are comparable (same type, quality, comparable value) or value differences are known • When definition of injury and benefits using a common metric is possible • The metric defines the injury more specifically and becomes the basis for restoration evaluation • When replacement of habitat/resource services is feasible • When replacement methodology is sufficiently understood to determine model parameters
Issues in Evaluating "Same Type/Quality" Criteria • Capacity • Does the project have the biophysical conditions necessary to provide desired service(s)? • Opportunity • Is the project located within an ecological landscape necessary to take advantage of capacity? • Payoff • How will providing service(s) at this location benefit people? • Equity • Who gains/loses by providing service(s) at this location? Drawn from "Comparing Ecosystem Services and Values", King, 1997
Site A • Near the coast, downstream is a beach area • Adjacent to large, healthy shellfish grounds that are accessible to the community • Upslope is agricultural land (nutrient runoff) • Wildlife corridor is open from the North • Located near residential areas (aesthetics, scenic) • Good access, adjacent to public lands Site B • Slightly off the coast, downstream is industrial site • Adjacent to fishing port and small shellfish beds that are contaminated and remote • Upslope is forest (no nutrient runoff) • Wildlife corridor is blocked by Highway 66 • Nearby industrial sites • Poor access, surrounded by private lands C.O.P.E.: A Graphical Example Wetland Site A and Wetland Site B are identical in size, shape and biophysical characteristics and are located in the same sub-watershed on either side of Highway 66. Example drawn from King, "Comparing Ecosystem Services and Values", Jan.12, 1997.
Habitat Equivalency Analysis:Four Basic Steps • Document and quantify the injury • Identify and evaluate replacement project options • Scale the replacement project to compensate for the injury • Determine the appropriate means of compensation • Cost selected restoration options • Set performance standards for compensatory restoration projects
Document and Quantify the Injury • Identify the types of habitat, biological resources, and resource services that have been injured; identify a metric • Metric defines the extent of the injuries • Area of injured habitat/resource • Severity of the injuries (e.g., 50% loss in services, 100%, etc.) • Determine the duration of the injury, given trustee choice of primary restoration • Will services ever return to baseline? • Recovery path
Identify and Evaluate Habitat Replacement Options • What types of habitats/resources provide services similar to those that were lost? • Are the values of replacement services and lost services comparable? • Trustees must determine the productivity of these alternatives relative to the baseline services of the injured resources? • How much time is required to implement the restoration/replacement projects? • Following implementation, how long willproject take to reach maximum function?
Scale the Replacement Project to Compensate for the Injury Over Time • Determine an appropriate discount rate • Compute a total discounted measure of lost service flows (e.g., lost acre years) • Compute a total discounted measure of the replacement service flows • Scale the replacement project so that total discounted service flows are equal
Required HEA Model Parameters Injury • Geographic extent of injury(s) • Choice of metric for injured and created resource • Services lost in initial period (until source control) • Duration over which resource injury will persist • Functional form of recovery curve (to baseline)
Required HEA Model Parameters Restoration • Time required for created resource to achieve maximum productivity • Functional form of created resource productivity curve • Productivity ratio of created to injured resource • Time horizon/lifespan of created resource • Discount rate
Benefit Quantification • Restoration parameters • Time of restoration • Time to project maturity and shape of path • Lifespan of the project • Productivity of restoration habitat relative to what was lost • Discount rate • Parameters determine the resource and service flows provided by the restoration habitat • Ultimately, calculate size of project such that the losses equal flow of benefits
Case Example • Blackbird Mine -HEA
Blackbird Mine Case Study Background Injury Assessment Settlement Restoration Actions
Background Panther Creek Drainage - major tributary to Salmon River, Idaho 830 acres of private land and 10,000 acres of unpatented mining claims Cobalt Mining started in 1853, with the most extensive period of production between 1949 to 1967 Releases contaminated 25miles of anadromous fish habitat Placed on NPL in 1994
Mining and processing of cobalt and copper from the area resulted in: •12-acre unreclaimed surface pit, • 10 miles of underground mine workings (tunnels), • 4.8 million tons of waste rock, • 2 million tons of mine tailings, • Numerous mine adits and portals • Ground/surface water contamination
Copper AWQS Exceedance High levels of heavy metals such as copper, cobalt and arsenic are present in surface waters and/or sediments up to 25 miles downstream of the mine Copper concentrations at some sites are over 100 times chronic AWQS P p m
Injury Assessment Focus on three Primary Ecosystem Indicators - Metrics Surface water quality criteria Streambed food web species Resident and Anadromous fish Streamlined assessment involved: 3 yrs of water quality surveys Geochemical complexation studies In situ bioassays Fish toxicity studies Biological restoration evaluation Site remediation alternatives
Injury Assessment Highly contaminated discharge from the mine site directly affects habitat in the lower 25 miles of Panther Creek Anadromous fish species eliminated from the drainage Resident trout populations severely depressed Streambed fauna biomass and species complexity reduced Panther Creek Redd Count
Restoration Goals Focus is on returning spawning salmon to the river Primary restoration - on site Restore water quality Restore injured resources to baseline 200 spawning adults in Panther Creek Compensatory restoration - on site and off-site Compensate for interim lost anadromous fish production through increasing habitat production
Blackbird Mine Primary and Compensatory Restoration 300 250 Baseline Compensatory Restoration 200 Interim 150 Adults Natural Level of Services 100 Primary Restoration 50 0 1981 1990 1999 2008 2017 2026 2035 2044 2053 2062 2071 2080 2089 2098 2107 2116 2125 2134 2143 2152 Year
Primary Restoration • Chinook Salmon Reintroduction • $2.5 million to construct and operate • Adult fish trap on Panther Creek - $0.9 M • Juvenile acclimation ponds - $0.5M • Hatchery modification - $1.0M
Compensatory Restoration • Evaluated benefits of restoration actions through fish population models • Cattle impacts on riparian habitat and stream sedimentation a major problem • Results: • Fence 1 miles of riparian corridor along Panther Creek • Fence 10.5 miles of riparian corridor on other salmon-producing streams in watershed • Stream bank modification, riparian and floodplain planting in Panther Creek
Blackbird Summary • Blackbird HEA was a timely and cost effective approach to scaling compensatory restoration • Restoration projects provided the same type and quality of resources as those lost due to contamination • The per unit comparable value of the restoration actions is not know • Assumed that the restored resources were of greater value due to relative abundance of salmon stocks
Conclusions • HEA is not complicated mathematically • HEA can be appropriate as a resource compensation method under specific assumptions • The difficulty and the challenge is determining defensible input parameters, especially an adequate metric • HEA is not a economic valuation method applicable to standard policy benefit/cost analysis where the goal is to determine optimal (efficient) allocation of scare resources (e.g. marginal benefits=marginal costs) • Cost of compensatory restoration projects is not a measure of the value of the resources to the public
j V --- p V Conclusions (cont’d) • Relaxation of the assumed equivalency of value can be done through developing a relative value of injured and restored resources • This may be an easier number to estimate than the absolute value of both the injured resources and restored resources
Goals for the Future • Improve our understanding of how to define metrics to most fully characterize injured and replacement resources and services • Better incorporate concepts of capacity, opportunity and payoff into our evaluation and design of restoration projects • Develop our ability to estimate relative value of injured and restored resources for scaling compensatory restoration