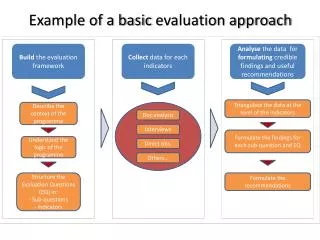
Evaluation Framework
Evaluation Framework. Russ Masco Matt Heusman. Objectives. To understand the necessity of formal evaluation in the education process To become familiar with components of evaluation, terminology, and a basic overview of some of the technical aspects of setting up an effective evaluation


Evaluation Framework
E N D
Presentation Transcript
Evaluation Framework Russ Masco Matt Heusman
Objectives To understand the necessity of formal evaluation in the education process To become familiar with components of evaluation, terminology, and a basic overview of some of the technical aspects of setting up an effective evaluation 3. An awareness of the planning needed before implementation if a program is to be evaluated for impact
Outline • Terminology • Stating the case for formal evaluation in education • Identify phases of evaluation • Discuss types of evaluation • Outline components of an ideal evaluation model • Brief mention of ethics, logistics, and alternatives to the ideal model
What we will not cover • Details of program implementation • Data collection process in great detail • Data analysis process • Drawing conclusions from the analysis
Baseline Data Categorical Data CauseCensus Data Continuous Data Control Group Dependent Variable Experimental Unit External Validity Extraneous Variable Independent Variable Internal Validity Level of Analysis n sizePopulation Practical Significance ReliabilityResearch QuestionSample-Set of Measurement Statistical Significance Treatment Treatment Group Unit of Analysis Validity
Baseline data-measurements collected from the units of analysis before any treatment is given • Categorical data-measurements that are based on groupings or are binary in nature (unable to distinguish the amount of difference between measurements) • Census data-The state of having a measurement of observation for every unit in the population of interest • Continuous data- measurements composed of actual numbers non-grouped (form a steady progression/interval of real numbers) • Control group- Portion of a sample or population that does not receive any treatment • Dependent variable-Observed result of the independent variable being manipulated (we don’t say that one caused the other) • Experimental Unit-The unit from which the sample is taken (student, school) these are not the sample • External validity-The degree to which results can be applied to other groups outside of the experimental group • Extraneous Variable- a variable other than the variable being measured that may have an effect on the dependent variable (Usually try to control for or minimize) • Independent variable-attribute taken as given. The value being manipulated or changed in an experiment or evaluation process. Usually associated with the treatment
Internal validity- the degree to which the experiment accurately measured what happened within the group (sample) the experiment took place within. • Level of analysis-The organizational level at which your experiment takes place • n size- The number of measurements in your sample (sample size) • Population- The entire set of measurements for the group of interest • Practical significance-An arbitrary limit whereby some difference in variables is useful • Relationship- A change in the amount of one variable results in the change of another variable (be careful when stating relationship versus cause!!) • Reliability-the degree to which someone could replicate your experiment and get the same results or that the same data would be collected in repeated observations • Research question-The question you wish the experiment to answer • Sample-set of measurements or observations (not the unit from which it was observed)taken from a larger group • Statistical significance- The likelihood that a relationship between variables is attributed to sampling error or to a true relationship (based on probability) • Treatment - an agent of change administered to something or someone • Treatment group- Portion of a sample of population that receives a treatment or agent of change • Unit of analysis- The entity from which the sample (measurement) is taken • Validity-Measuring what you are intending to measure
Why? • One of the ways to get more support for programs is to convince people that programs are working • May translate to money and monetary support for education • Generate excitement and understanding in the community • Exposure • Share ideas across the state • Impact policy • Much less threatening the evaluate a program during than afterwards Prezi
Research Question • Will be based on the objectives of the evaluation • Will drive the rest of the evaluation (experiment) • Sampling procedure • Baseline data collected • Level of analysis • Unit of analysis • Level of data collected (measurement) • Categorical • Nominal • Interval • Continuous • Interval • Ratio • Statistical procedure • How the conclusion is stated The importance of the research question cannot be overstated. Must start thinking about it early.
Program Determination • Who is eligible • Able to select some and not others • Is it gold plated or is it feasible to implement program if successful on a larger scale
Theory of Change • Who is the target • What are their needs • What is the program seeking to change • What is the precise program or part of program being evaluated • Intermediate indicators • Final outcomes • What are the measureless
Needs Assessment • Who is the target population • What is the nature of the problems being solved • How does the service fit into the environment, curriculum • Consideration for support and professional development • Clear sense of need program will fill • Clear sense of alternatives • Use data (qualitative and quantitative) to identify needs
Logical Framework Needs Input Output Outcome Impact Children use tablets and are able to study better. Low income, and low learning, with limited or no access to technology School District purchases tablet devices. Higher test scores. Better standard of living. Long term.
Evaluation Components • Needs Assessment • Process Evaluation • Impact Evaluation • Review • Cost-Benefit Analysis • Extended Impacts – unexpected results or outcomes
Process Evaluation • Are the services being delivered • Can it be done at a lower cost • Are the services reaching the intended population • Support for participants • Teachers • Students • Parents • Other stakeholders
Impact Evaluation • What impact did the program have on?? • How does it relate to the theory of change? • Intermediate indicators • Final outcomes • Distributional Questions • Program or Treatment satisfaction
Part of the objective of evaluation is to determine if a program (treatment)/Independent variable impacts another dependent variable
Research Question • Will be based on the objectives of the evaluation • Will drive the rest of the evaluation(experiment) • Sampling procedure • Baseline data collected • Level of analysis • Unit of analysis • Level of data collected (measurement) • Categorical • Nominal • Interval • Continuous • Interval • Ratio • Statistical procedure • How the conclusion is stated • The importance of the research question cannot be overstated
Questions to think about related to research question • To whom are the conclusions of the evaluation being applied? • Just the group from which the control group and the treatment group was taken • To a group larger than just the sample group • District 00-0000 school children • ESU 00 School children • Nebraska School children • USA school children
Sampling • Is all about to whom or what you want generalize your results • Will make or break your external validity • Population from which you sample will be as far as you can generalize your results • If you want to know about all students in the USA each student in the US would need to have the equal probability of being chosen for the sample
y And results can not be applied to separate population with different characteristics even if one is similar Sample must represent the population if results are to be applied x
Decision • Do you have census data • Yes • You do not need to worry about sampling procedure at times • May still need to randomize assignment to control and treatment group • Often time the analysis will be based on Practical conclusions not probabilities • Results will only be applied to that group • No • Must be concerned about sampling as well as assignment • Analysis will be based on probabilities (statistics) • Note: There are different ways to think about the definition of census data • All students in a school • All students in and ESU’s boundary
More Things to Consider • Scale of measurement for independent variable • Present/Absent • or • How much present/absent • requires more than one treatment group • Means smaller sample size for each group(less powerful test)
Even more things to consider • Scale of measurement for dependent variable • Impact Yes/No or How much impact • Will determine type of data collected continuous or categorical • Which determines data analysis (statistical) procedure that is appropriate • Usually best to collect most detailed level of data possible • If continuous data is available collect at that level • Easy to move to categorical from continuous but not the other way
Ideal method (true experiment) Determine the population from which to sample Determine how many treatment groups you will need Will need a group for each treatment and one for control Many times one treatment group and one control group Caution: The more groups you break your sample into the more power you lose in your test as n size decreases n size Power of test Power of test = how sure you are of a relationship existing between two variables When n size decreases confidence interval will be larger(wider)
How do we know that the variables we are measuring are related Or is it other (extraneous) variables?
Student Variables Treatment Group Reading scores increased Home Support Motivation Language Fluency Which student variables are related to the increase in reading scores Control Group Reading scores stayed the same Learning style match Reading program
Treatment Group Control Group Baseline Data Reading Scale Score Treatment Control Aug. Nov. Jan. March May School Year
How were the treatment and control group members assigned? All from one classroom All from one side of the classroom Could those other variables be grouped by the classroom or by the side of the classroom?
Three ways to be sure other variables are not the ones showing the relationship or to equalize the impact on the outcome
Method 1 • Control for all variables that may impact the result • List all variables (independent ) that may impact the results (dependent variable) • Control for those “Other” extraneous variables • Means hold them constant • Would need to quantify extraneous variables
Example of method 1 Start with 100 students Only take those of a certain Home support level x =70 students Only use Students with a certain learning style Y 50=students Only take students with a motivation level Z 30=students Small n lower level of power in test May only have 15 in each group when divided into treatment and control
Method 2 Measure each of the extraneous variables Potentially creates a more statistically and logistically complex analysis like: Multiple regression models versus a comparison of means(T-test or ANOVA) May also increase the complexity of implementation Would need to be able to quantify the extraneous variables
Method 3 Randomly assign students to the control and treatment group Random meaning that each subject has the equal probability of being selected for the treatment or control group Added benefit Still have 50 in each group= more powerful test!
Sample must represent the population if results are to be applied Randomly assigned !!! Treatment Group Control Group
Why Random? Spreads out extraneous variables other than the reading program evenly in both groups So we can assume to a greater degree that the reading program is related to the change because the other (extraneous) variables should impact both groups the same.
Non-Random assignment Treatment Group Control Group Subject 1 motivation =10 Subject 1motivation=3 Subject 2 motivation= 8 Subject 2 motivation=4 Subject 3 motivation= 9 Subject 3 motivation=3 Subject 4 motivation=9 Subject 4 motivation=3 If the reading program had no influence the treatment group may still show post test scores higher than control Was it reading program or motivation? VS. Random Assignment Treatment Group Control Group Subject 1 motivation=3 Subject 1 motivation=9 Subject 2 motivation=10 Subject 2 motivation=4 Subject 3 motivation= 3 Subject 3 motivation=8 Subject 4 motivation=9 Subject 4 motivation=3 Now the impact of motivation is distributed equally between the two groups Results more likely to indicate a relationship between the variables
Steps Determine Population to be sampled To whom do you wish to generalize the results Determine which level of subject to be randomized over
What Level to Randomize • School or students in a school • Some of this will be determined by the research question • The higher level of randomization the harder it will be to obtain a large sample size • But the easier to generalize to larger groups • Must find the balance
Assign Each Subject a Number • Use a random number generator or table to pick numbers for the • Treatment group • Control group • Assign subjects to the groups based on results of table or number generator
At this point researchers will sometimes do a check of the groups for homogeneity between the groups on variables determined to randomized over This can add a considerable cost and time to the evaluation
Baseline data For the variable you are measuring collect values for that variable before you start the treatment Treatment group Control group This may also be called pre-test data Test (NeSA, NRT etc.) offer this automatically but if it is locally collected data this must be considered.
Due Dates You’ll let us submit late
Sample Fall Calendar SAMPLE
Administer the treatment Watch the process One group getting the treatment impacts the results of the control group Students that got books (treatment) shares the books with friends who did not (control)
Post Test Collect post test values
Compare Data analysis Pre-test control to post test control Pre-test treatment to post-test treatment Greater difference between pre and post results in the treatment group = There is a relationship between the independent and dependent variable There is a relationship between the treatment (independent variable) and the outcome (dependent variable) being measuring
Treatment Group Control Group Baseline Data Reading Scale Score Treatment Control Aug. Nov. Jan. March May School Year