Download
1 / 99
990 likes | 1.11k Vues
Explore the essential aspects of long-term economic growth, from the production function to growth accounting equations. Delve into the impacts of capital, labor, and productivity on economic growth, analyzing trends and slowdowns post-1973. Discover the Neoclassical Growth Model and its insights into factors shaping a nation's standard of living and growth trajectory.

E N D
Long-Run Economic Growth Prof Mike Kennedy
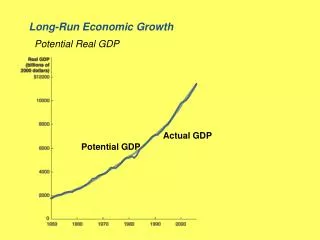
Why growth matters:Small changes make a big difference over a lifetime
The Sources of Economic Growth • The relationship between output and inputs is described by the production function: Y = AF(K, N) • For Y to grow, either quantities of Kor N must grow or productivity (A) must improve, or both.
The Growth Accounting Equation • The growth accounting equation: ∆Y/Y is the rate of output growth; ∆K/K is the rate of capital growth; ∆N/N is the rate of labour growth; ∆A/A is the rate of productivity growth.
The Growth Accounting Equation (continued) aK = elasticity of output with respect to capital (about 0.3 in Canada); aN = elasticity of output with respect to labour (about 0.7 in Canada).1 • The elasticity of output with respect to capital/labour is the percentage increase in output resulting from a one per cent increase in the amount of capital stock/labour. 1Recall the table on income shares in lecture on the national accounts (Chap 2).
The Growth Accounting Equation (continued) • There is another way to derive the equation using logs. The production function can be written as: ln(Y)= ln(A) + αKln(K) + αNln(N) • The term “ln” means the natural log of the variable in question. • Since the first derivative of the natural log of a variable is approximately equal to the proportional change then: dln(Y)= dln(A) + αKdln(K) + αNdln(N) • This is approximately equal to growth accounting equation in slide 7. • Note that dln(X) is approximately ∆X/X for somewhat small changes (around 5% or less).
Growth Accounting • Growth accounting measures empirically the relative importance of capital stock, labour and productivity for economic growth. • The impact of changes in capital and labour is estimated from historical data. • The impact of changes in total factor productivity is treated as a residual; that is, not otherwise explained.
Growth Accounting and the Productivity Slowdown • Output growth was rapid during 1962-1973 and then slowed in 1974-2006. • Much of the decline in output growth can be accounted for by a decline in productivity growth. • The slowdown in productivity starting in 1974 was widespread, suggesting a global phenomenon.
The Post-1973 Slowdown in Productivity Growth • Explanations of the reduced growth in productivity are: • Output measurement problem: • Quality of output and inputs • Shifts to lower productivity sectors • Measurement problems have always been there • Technological depletion and slow commercial adaptation: • The easy stuff has been used up • Firms slow to take up new technologies
The Post-1973 Slowdown in Productivity Growth (cont’d) • The dramatic rise in oil prices: • Old capital was energy intensive and thus inefficient • Timing and the fact that the slowdown was international in scope make this an attractive story • But price of capital did not fall and energy was not that important for several sectors • As well, productivity should have picked up when oil prices fell in the 1980s – it did somewhat but later • The beginning of a new industrial revolution: • The beginning of the computer age • Takes time to adopt new technologies • Have seen some pick up in productivity • The industrial revolution was like this
The More Recent Experience:After a Pickup, Total Factor Productivity Has Slowed…
Contributions to potential growth since 1985(based on growth accounting equation)
Growth Dynamics: The Neoclassical Growth Model • Accounting approach is just that – it is not an explanation of growth. • The neoclassical growth model: • clarifies how capital accumulation and economic growth are interrelated; • explains the factors affecting a nation’s long-run standard of living; • is suggestive of how a nation’s rate of economic growth evolves over time; and • can say something about convergence – do poor countries/regions catch up?
Assumptions Underlying the Growth Model • Assume that: • population (Nt) is growing; • at any point in time the share of the population of working age is fixed; • both the population and workforce grow at a fixed rate n; • the economy is closed and there are no government purchases.
Setup of the Model of Economic Growth • Part of the output produced each year is invested in new capital or in replacing worn-out capital (It). • The part of output not invested is consumed (Ct). Ct= Yt – It
The per-Worker Production Function • The production function in per worker terms is: yt= Atf(kt)(6.5) yt = Yt/Nt is output per worker in year t kt = Kt/Ntis capital stock per worker in year t At =the level of total factor productivity in year t • When the production is written like (6.5) it is often called the “intensive form”.
Graph of the per-Worker Production Function • The production function slopes upward. As we move rightward, K is rising faster than N so that k increases. • With more capital, each worker can produce more output. • The slope gets flatter at higher levels of capital per worker due to diminishing MPK.
Steady States • In a growth model, equilibrium is defined by something called the steady state. • A steady state is a situation in which the economy’s output per worker (yt), consumption per worker (ct), and capital stock per worker (kt) are constant; these ratios do not change over time. • Remember that these variables are all ratios to Nt so that for example both Yt and Nt are growing but yt, the ratio of the two, is constant.
Steady States (continued) • Holding productivity growth constant, the economy reaches a steady state in the long run. • Since yt,ctand kt are constant in a steady-state, Yt,Ctand Kt all grow at rate “n”, the rate of growth of the workforce. • As noted above, this is the definition of the steady state.
Characteristics of a Steady State • Gross investment in year t is: It=(n + d)Kt • Kt grows by nKtin a steady state, which ensures that K/N is constant. • Kt depreciates by dKtwhere d is the capital depreciation rate. • Is this equation consistent with what we have already studied about investment?
Characteristics of aSteady State (continued) • We can show that it is consistent with what we have already studied. Start by differentiating (K/N) and setting that derivative to zero (i.e., fulfilling the condition that K/N does not change). Using “Δ” to represent changes: (note ΔN/N = n, the growth rate of the labour force, and we have multiplied the first expression by N) • Using the gross investment identity (I = K* – K + dK) and remembering that ΔK = K* – K = nK in the steady state we get: I =(n + d)K (See Addendum 2 for the discrete version)
Characteristics of aSteady State (continued) • Consumption is total output less the amount used for investment. Ct= Yt – (n + d)Kt (6.7) • Put Eq. (6.7) in per-worker terms. • Replace yt with Atf(kt)(Eq. (6.5)). ct= Atf(kt) – (n + d)kt(6.8)
Steady-State Consumption per Worker • An increase in the steady-state capital-labour ratio has two opposing effects on consumption per worker: • it raises the amount of output a worker can produce, Af(k); and • it increases the amount of output per worker that must be devoted toinvestment, (n + d)k.
Steady-State Consumption per Worker (continued) • The Golden Rule level of the capital stock maximizes consumption per worker in the steady state. • At that point the slope of the production function (it’s derivative wrt to k) equals (n + d), the slope of the investment line. • From this we can show that r = n, sometimes referred to as the biological interest rate. • The key here is to use the definition of the user cost of capital assuming no taxes and a price of capital normalised to equal one: MPKG=(n + d)=(r + d) implying that r = n
Steady-State Consumption per Worker (continued) • The model shows that economic policy focused solely on increasing capital per worker may do little to increase consumption possibilities of the country citizens if we are close to the Golden Rule level of k. • Empirical evidence is that, given existing starting conditions, a higher capital stock would not lead to less consumption in the long run; i.e., economies are away from kG. • We will assume that an increase in the steady-state capital-labour ratio raises steady-state consumption per worker.
Reaching the Steady State • We haven’t described how an economy would reach a steady state. • Why will the described economy reach a steady state? • Which steady state will the economy reach? • The piece of information we need is saving. • Assume that saving in this economy is proportional to current income: St= sYt(6.9) where “s” is a number between 0 and 1. • It represents the faction of current income saved.
Reaching the Steady State(continued) • National saving (in this case, private saving as there is no government in the model) has to equal investment. • Here we set our simple saving function equal to the amount of investment that is required to maintain the capital-labour ratio constant: sYt=(n + d)Kt(6.10)
Reaching the Steady State(continued) • Put Eq. (6.10) in per-worker terms. • Replace Yt with Atf(kt) (Eq. (6.5)) sAf(k)=(n + d)k(6.11) • Subscript t is dropped because the variables are constant in the steady state.
Steady-State Capital-Output Ratio • Equation 6.11 says that, in the steady state, the capital-labour ratio must ensure that saving per worker and investment per worker are equal. • k*is the value ofk at which the saving curve and the steady-state investment line cross. • k*is the only possible steady-state capital-output ratio for this economy.
Equilibrium in the Solow-Swan growth model (note that the position k* is stable)
The Steady-State Consumption per Worker • Steady-state output per worker is: y* = Af(k*) • Then the steady-state consumption per worker is: c* = Af(k*) – (n + d)k* • While steady-state investment per worker is: i* =(n + d)k* • Note that the steady-state investment curve slopes upward because a higher k means more I is needed to maintain it.
The Model’s Implications • The economy’s capital-labour ratio will converge to k*. • It will remain there forever, unless something changes. • In this steady state the capital-labour ratio, output per worker, investment per worker, and consumption per worker all remain constant over time. • The model determines an equilibrium but not growth – that is given by assumption.
The Model’s Implications (continued) • If the level of saving were greater than the amount of investment needed to keep k constant, then that extra saving gets converted into capital and k rises. • If saving were less than the amount needed to keep k constant, the reverse would happen – k would fall. • Note that there is no reason to suppose that the steady state is at a point of maximum consumption – the “Golden Rule”.
The Model Implications (continued) • You could get a situation in a poor country where, at low levels of income, saving is below (n + d)k– that is, it is not high enough for the country to reach the level of income in other countries, • Here it is possible to have a low steady state, which is unstable. • A negative shock pushes the economy towards poverty • A positive shock has the opposite effect • Stability here requires that the saving function crosses (n + d)k from above. • Note that the unstable point is bounded by two stable points.
The Determinants of Long-Run Living Standards • Long-run well-being is measured here by the steady-state level of consumption per worker. • Its determinants are: • the saving rate (s); • the population growth rate (n); • the rate of productivity growth (how fast A grows).
Long-Run Living Standard and the Saving Rate • A higher saving rate implies a higher living standard. • The increased saving rate raises output at every level of capital per worker. • A steady-state with higher output and consumption per worker is attained in the long run.
The Saving Rate (continued) • An increase in the saving rate has a cost – a fall in current period consumption. • As before, in the decision to consume, there is a trade-off between current current and future consumption. • Beyond a certain point, the cost of lost consumption today will outweigh the future benefits.
The Saving Rate (continued) • It is also the case that a policy that increases saving will generate a temporary spurt in the growth rate. • Since y = Y/N and N is growing at a constant rate (n), then as we move to a new and higher k*output must grow faster than n at least temporarily.
Long-Run Living Standard and Population Growth • Increased population growth tends to lower living standards. • When the workforce is growing rapidly, a larger part of current output must be devoted to just providing capital for the new workers to use. • Absent here is any effect increased population may have on output – increased immigration of highly skilled workers would improve growth by raising TFP.
Population Growth (continued) • However, a reduction in population growth means: • lower population and lower total productive capacity; • lower ratio of working-age people to the population and perhaps an unsustainable pension system. • In some countries, low population growth can be raised by encouraging immigration and/or higher female participation.