Download
1 / 20
200 likes | 308 Vues
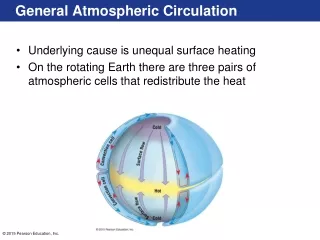
This study aims to understand atmospheric circulation patterns on exoplanets through advanced observations and modeling. By analyzing multi-wavelength data and investigating temperature variations, the research sheds light on the physical processes governing these atmospheres.

E N D
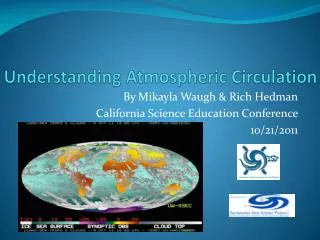
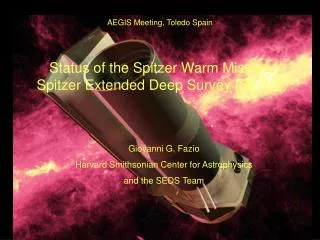
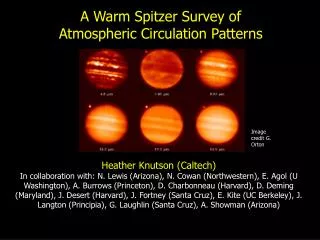
A Warm Spitzer Survey of Atmospheric Circulation Patterns Image credit G. Orton Heather Knutson (Caltech) In collaboration with: N. Lewis (Arizona), N. Cowan (Northwestern), E. Agol (U Washington), A. Burrows (Princeton), D. Charbonneau (Harvard), D. Deming (Maryland), J. Desert (Harvard), J. Fortney (Santa Cruz), E. Kite (UC Berkeley), J. Langton (Principia), G. Laughlin (Santa Cruz), A. Showman (Arizona)
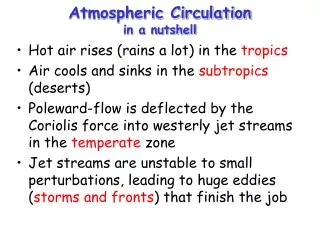
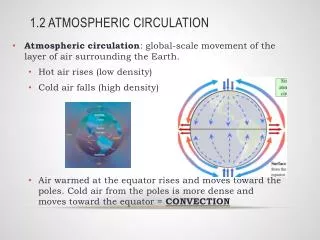
Goals for hot Jupiters: Test basic predictions of circulation models. Understand how/why circulation patterns vary. What does this tell us about the relevant physical processes in these atmospheres? Image credit: ESA/C. Carreau
Why care about circulation? We are currently treating 3D atmospheres like 1D objects. Temperature Map for HD 189733b (Showman et al. 2009) Local differences in composition and thermal structure can alter shape of observed spectra. Latitude 30 mbar Longitude Is this a reasonable or an unreasonable assumption? We have no idea!
First Longitudinal Temperature Profile for an Exoplanet:HD 189733b’s Hot Night Side at 8 μm 1200 K 1000 K 1000 K 1200 K Observer’s view of planet Spitzer 8 μm observations of HD 189733b (Knutson et al. 2007b)
A Broadband Emission Spectrum For HD 189733b Charbonneau, Knutson et al. (2008), Barman (2008) We just calculated a temperature based on a single band! That can’t be correct…. Model Data Want spectrum as a function of orbital phase.
New Warm Spitzer Observations Multi-wavelength (3.6, 4.5 + old 8.0, 24 μm). Full orbit (75 hours). But where is the phase curve? 3.6 μm 4.5 μm
Pixel Maps & Star Spots The brightness of the star can vary as spots rotate in and out of view. Ballard et al. (2010) Relative Flux 12 day rotation Winn et al. (2007) Photometric Phase Fit data simultaneously to determine pixel response as a function of x and y position, linear slope due to stellar rotation, and planet phase curve.
Final Corrected HD 189733b Light Curves 3.6 μm 4.5 μm Flux from star alone Observer’s view of planet Amplitude: 0.0913% ± 0.0039% ΔT = 311 ± 15 K Amplitude: 0.1295% ± 0.0078% ΔT = 374 ± 31 K See Cowan & Agol (2008) for description of functional forms for phase curve fits.
Night Side Comparison to 1D Atmosphere ModelsBurrows et al. (2008), Grillmair et al. (2008) How well can we infer night side properties based on dayside spectra? Day Side Solar composition, equilibrium chemistry, extra absorber κ with opacity 0.035 cm2/g, 15% of incident flux transported at depth to the night side. Model Data
Comparison to 3D Atmosphere ModelsShowman, Fortney et al. (2009) New data. Errors are 7-10x smaller! Solar, 5x solar
A Growing Diversity of Circulation Patterns 4 mag. fainter HAT-P-7b 3.6 μm 8x smaller 4.5 μm HD 149026b HAT-P-7b is very hot (~2500 K)… could MHD effects brake the atmospheric flows? HD 149026b likely has a high metallicity. Could increasing the opacity result in larger temperature gradients? Observer’s view
HD 189733b with Warm Spitzer 3.6 μm 4.5 μm Observer’s view of planet Highlights: Spectrum as a function of orbital phase -> chemistry, P-T profiles Max/min offsets consistent with a simple super-rotating equatorial jet. Emerging evidence for large day-night T gradients on some planets.
Overlapping data sets allow for consistency checks on corrections. 3.6 μm 4.5 μm Y Position (pixels) X Position (pixels) X Position (pixels)
Spot Variations for New Obs. Ground-based photometry in (b+y)/2 from Greg Henry’s APT telescope.
Observed as part of CoRoT-7 program, PI Francois Fressin Ramp as a function of illumination level for a 1-hour observation of a bright, diffuse HII region.
HD 189733b, Charbonneau et al. (2008) New: Old: 0.256±0.014% 0.150±0.002% 0.214±0.020% 0.182±0.002%
HD 189733 at Two Wavelengths HD 189733 at 8 μm Knutson et al. (2007b) Same day-night temperature gradient from both light curves. Why so similar? Two possibilities: Both wavelengths originate from the same pressure Day-night contrast is similar over the relatively modest factor of ~2-3 in pressure sensed by these two wavelengths HD 189733b at 24 μm Knutson et al. (2009a)
Comparison to 1D Atmosphere Models New errors are 7-10x smaller!