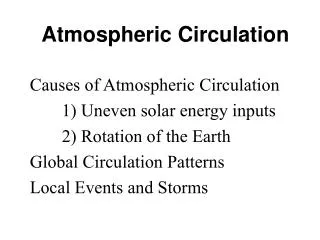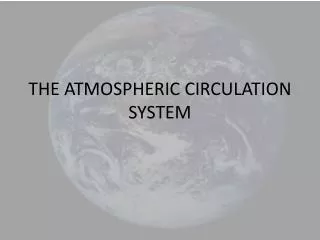
Understanding Atmospheric Circulation
380 likes | 524 Vues
This presentation by Mikayla Waugh and Rich Hedman at the California Science Education Conference explores atmospheric circulation through model-based reasoning (MBR). It encourages learners to engage with basic and complex models, emphasizing the principles of air movement, convection currents, and the impact of Earth's size and spin on wind patterns. The session includes hands-on tasks that promote collaborative learning and data-driven model revisions, fostering a deeper understanding of global weather phenomena and the scientific consensus on wind patterns.

Understanding Atmospheric Circulation
E N D
Presentation Transcript
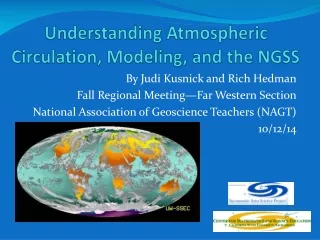
Understanding Atmospheric Circulation By Mikayla Waugh & Rich Hedman California Science Education Conference 10/21/2011
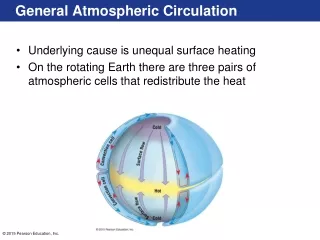
Model-based Reasoning • The lessons were designed to engage the learner in model-based reasoning (MBR). • A model is an idea or a group of ideas that helps us understand or explain the way something works. • We are going to guide you through developing your own understanding of atmospheric circulation.
Prior Knowledge—Assumptions • Convection/density currents in fluids. • Specifically: ↑ temperature → density (and vice versa) – and then what happens BECAUSE of this • Air is a fluid. • Wind is a current of air.
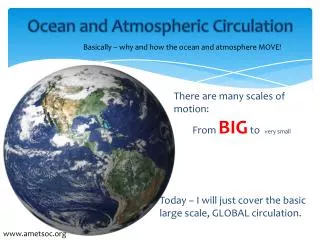
Phenomena: Global Cloud Motion What patterns do you notice?
Driving Question • What causes the patterns in earth’s atmospheric circulation? • We will answer the question by developing explanatory models, from basic to complex.
Consider the Earth • Where is it usually warm on earth? • Where is it usually cold on earth?
Make a Prediction Make a prediction: • Where would air be rising from earth’s surface? • Where would air be sinking toward earth’s surface?
Task 1: Basic Model In the end, students’ globes will look something like:
Task 1: Basic Model In the end, students’ drawings should look something like:
Compare Basic Model to Phenomena Our Basic Model Actual Phenomena Our basic model has a problem! We need more data.
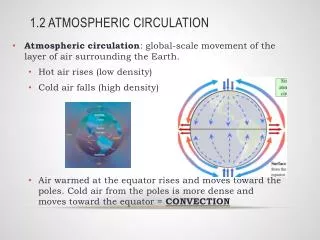
Data: Earth is Big! Because earth is so big, warm air rising at the equator cools well before it reaches the poles. This air at altitude doesn’t reach the north pole, it cools and sinks long before it reaches the pole.
Earth is Big! (Cont.) Also, because earth is so big, cold air sinking at the poles warms well before it travels back to the equator. This surface air doesn’t reach the equator, it warms up and rises well before it reaches the equator.
Task 2: Revise the Basic Model Task 2: With your group, 1. Discuss how to best revise your model to take into account that earth is large. 2. Then use the transparency strips to make a 3-D representation of the convection cells around the globe implied by your model. Draw arrows on the transparency strips to indicate the direction of air. Use red for warm air and blue for cold air. 3. Be prepared to share and explain your model.
Task 2: Revise the Basic Model (Cont.) 4. On poster paper, sketch a circle for earth, and draw in your convection cells and your predicted surface air currents. Use red for warm air and blue for cold air.
Task 2: Share & Explain Group Models • Groups share and explain their revised basic models. • After discussion, develop a class consensus model that fits the data we have so far.
Class Consensus Model The class consensus model should look something like:
Compare Class Model to Phenomena Our Class Model Actual Phenomena Our model still has a problem! We need YET MORE DATA
Data: Earth is Spinning! • Earth’s spin is counter-clock wise (CCW) when viewed from the North Pole. • Earth’s spin is clockwise (CW) when viewed from the South Pole. CCW CW
Data: Earth is Spinning! • While watching, pay attention to the data patterns. • If spinning clockwise, the ball is deflected? • If spinning counter-clockwise, the ball is deflected?
Task 3: Final Model How would this affect the wind directions on your model? Draw in the deflections you predict will occur on your poster.
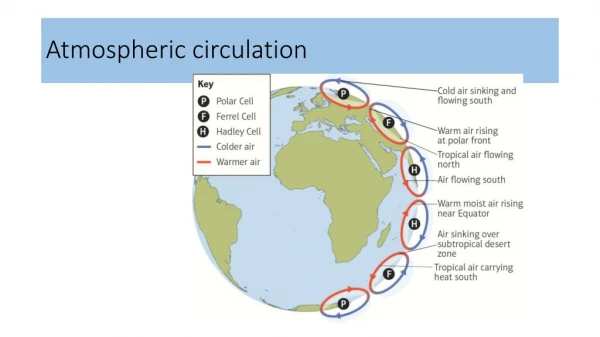
Task 3: Final Model Have a group or two share their final model. Now let’s look at the scientific consensus of the wind patterns…
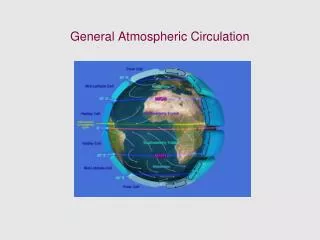
Final Model Surface Winds N. Hemisphere winds deflected to the right of original path. S. Hemisphere winds deflected to the left of original path. Final Model
Final Model Surface Winds Alternatively: In both hemispheres, poleward wind is deflected to the EAST, and equatorward wind is deflected to the WEST. Final Model
Compare Final Model to Phenomena Final Model Actual Phenomena Our final model predicts the actual wind patterns!
Simple Version of Final Model Our simple model which explains earth’s atmospheric circulation: Uneven heating of earth + earth’s large size + earth’s spin rate => observed global wind patterns. We can describe the causal relationships within this model in much more detail . . . (next slide)
Linked to Earth Sci Stds 5 & 6: 5. Heating of Earth’s surface and atmosphere by the sun drives convection within the atmosphere and oceans, producing winds and ocean currents. As a basis for understanding this concept: a. Students know how differential heating of Earth results in circulation patterns in the atmosphere and oceans that globally distribute the heat. b. Students know the relationship between the rotation of Earth and the circular motions of ocean currents and air in pressure centers. c. Students know the origin and effects of temperature inversions. d. Students know properties of ocean water, such as temperature and salinity, can be used to explain the layered structure of the oceans, the generation of horizontal and vertical ocean currents, and the geographic distribution of marine organisms. e. Students know rain forests and deserts on Earth are distributed in bands at specific latitudes. f.* Students know the interaction of wind patterns, ocean currents, and mountain ranges results in the global pattern of latitudinal bands of rain forests and deserts. g.* Students know features of the ENSO (El Niño southern oscillation) cycle in terms of sea-surface and air temperature variations across the Pacific and some climatic results of this cycle. 6. Climate is the long-term average of a region’s weather and depends on many factors. As a basis for understanding this concept: a. Students know weather (in the short run) and climate (in the long run) involve the transfer of energy into and out of the atmosphere. b. Students know the effects on climate of latitude, elevation, topography, and proximity to large bodies of water and cold or warm ocean currents. c. Students know how Earth’s climate has changed over time, corresponding to changes in Earth’s geography, atmospheric composition, and other factors, such as solar radiation and plate movement. d.* Students know how computer models are used to predict the effects of the increase in greenhouse gases on climate for the planet as a whole and for specific regions.
Thank you! • Contact information: • Rich Hedman hedmanrd@csus.edu • Mikayla Waugh mikaylaw@vacavilleusd.org • These lessons resulted from teacher collaboration during the 2009-2010 school year supported through a UC Davis / National Science Foundation grant. • The program is called Innovations in Science Instruction through Modeling (ISIM), which is coordinated by the Sacramento Area Science Project (SASP).
Assessing Student Understanding One option: • Use our final model of atmospheric circulation to explain earth’s surface wind directions in each band of latitude.
Assessing Student Understanding Another option: • Use our final model of atmospheric circulation to explain the high pressure at the poles and 30˚ latitude lines and low pressure along the equator and 60˚ latitude lines:
Extensions or Assessment Even with the simple model: Uneven heating of earth + earth’s large size + earth’s spin rate => observed global wind patterns We can ask a lot of interesting questions: • What happens if we vary the planet’s spin rate? • What happens if we change the spin direction? • What happens if we have a small planet? • What happens if we have a giant planet? • What happens if the temperature differential is greater? • What happens if the temperature differential is less?
Ok, That’s Really the End! • Contact information: • Rich Hedman hedmanrd@csus.edu • Mikayla Waugh mikaylaw@vacavilleusd.org • These lessons resulted from teacher collaboration during the 2009-2010 school year supported through a UC Davis / National Science Foundation grant. • The program is called Innovations in Science Instruction through Modeling (ISIM), which is coordinated by the Sacramento Area Science Project (SASP).