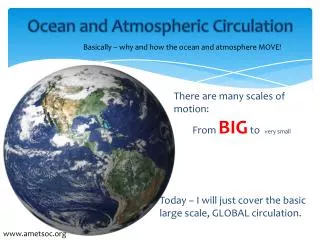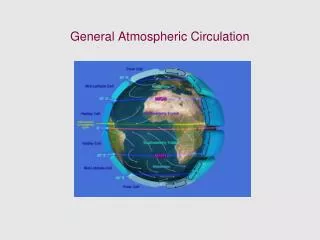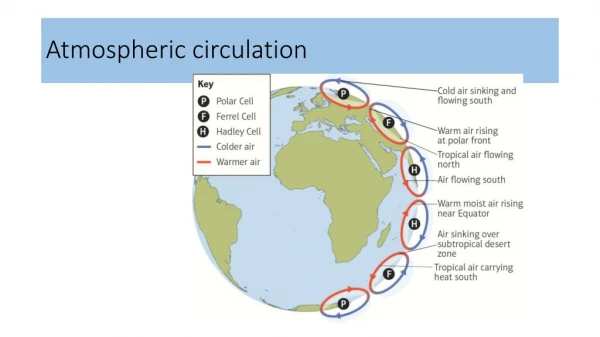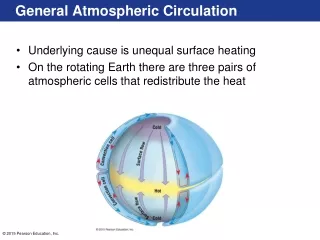
Global atmospheric circulation
Global atmospheric circulation. Location of cyclonic storms. Due to Coriolis forces, cyclonic storms must form at least 300 mi from the Equator (about 5 degrees N or S). Traits common to tropical cyclones Form between latitudes of 5° and 20° N or S

Global atmospheric circulation
E N D
Presentation Transcript
Location of cyclonic storms Due to Coriolis forces, cyclonic storms must form at least 300 mi from the Equator (about 5 degrees N or S)
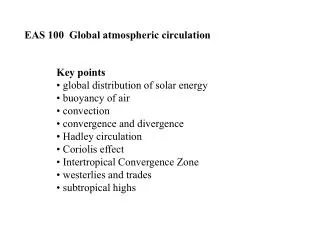
Traits common to tropical cyclones • Form between latitudes of 5° and 20° N or S • Most common in summer months of respective hemisphere • Form in E or SW Pacific, E N Atlantic Ocean, and N Indian Ocean • Rotational winds produce low pressure • Warm water of 25 - 26° C [77-80° F] • Extratropical cyclones • Form over land or water in higher latitudes, usually 30 - 70 ° latitude • Cool central cores driven by jet stream
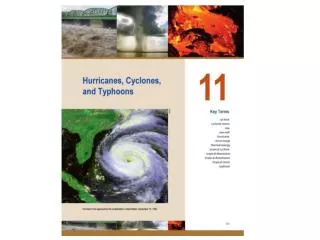
Definitions of Tropical, Low-Pressure Weather Systems. Storms begin as Disturbances and can Become Hurricanes • Tropical disturbance • Organized mass of convectional air and thunderstorms with partial rotation present; generally 100 to 300 nautical miles in diameter that originate in the subtropics or tropics • Tropical depression • Closed circulation with sustained winds of 38 mph (33 kt or 62 kph) or less • Tropical storm – NAME ASSIGNED NOW • Sustained winds (1-minute measurement, 10 m above water) of 39 mph (63 kph or 34 kts) up to 73 mph (63 kts) • Hurricane • Sustained winds of 74 mph (119 kph or 64 kts) or more
Naming of storms • Done when tropical storm forms (winds > 39 mph) • Helps keep track of storm • Six lists are used which repeat in 6 yrs • Men’s names added in 1979 and alternate with women’s names each year • This year–Alberto, Beryl, Chris, Debby, Ernesto… • Names retired for major storms • Hugo, Carla, Floyd, Katrina, Rita, Sandy, Wilma • 77 retired since 1954, 28 since year 2000!
For United States, between 1851 and 2004, tropical storm occurrence rate • On average • 8.5 storms per year • 5.2 hurricanes • 1.8 hurricanes hit land in U.S. • Worst months • September, August, October
NOAA Predictions for 2013 season Jun 1 – Nov 30) • 13 to 20 named storms • 7 to 11 become hurricanes (>74 mph winds) • 3 to 6 will be major hurricanes (111 mph or greater – Category 3) William Gray (Colorado State University) predicts • 18 named storms • 9 make hurricane status (>74 mph winds) • 4 major hurricanes (Category 3 or higher)
Thermal energy drives cyclone • Rotational forces extract more water and heat from ocean surface • Unstable conditions aloft • Concentration of energy toward center • Spinning ice skater effect • Conditions worsen • In northern hemisphere • Storms curve to right • Prevailing trade winds, Bermuda High and Coriolis forces affect storm tracks
Two jet streams 33,000 ft alt Stronger 110 mph winter 55 mph summer 43,000 ft alt weaker
Cape Verde source area
Year 2005 was the worst in terms of number of named storms • 21 formed, all names were used, so Greek letters were assigned to the last six • Letter not used for names • Q, U, X, Y, Z
Comparative activity 2005 hurricane activity 2006 hurricane activity
Comparative activity 2008 hurricane activity 2010 hurricane activity
Hurricane Sandy changes Oct 25, 2012 Oct 28, 2012
Hurricane Sandy facts • Worst North Atlantic storm in 2012; second most costly in US history ($50 billion; 285 died in seven countries) • Category 3 when it hit Cuba; intensity changed but was Cat 2 when offshore of US • Largest Atlantic storm (1,100 miles in diameter) • Called “Superstorm” due to its severity and widespread damage; merged with Arctic cold front • Hit coast of New Jersey on Oct 29th, relatively late in the season • Warm sea surface temperatures off East Coast (about 5 deg F above normal) • High pressure cell off Greenland stopped its normal eastward motion • Massive flooding in New Jersey and New York city.
Effects of cyclonic storms • Storm surge • Wind-pushed waves; fetch in NE quadrant • Lower pressure raises water level • Effects amplified in bays and lagoons; seiches • Worst at high tide • Record surge 42 ft in Australia! • Flooding • Greatest killer; often freshwater (rainfall flooding) • Avg hurricane produces rainfall equal to the flow of the St. Lawrence River in THREE SECONDS!
Heavy rain • Average storm produces about one trillion gallons of rainwater daily, 3x annual usage in U.S. • T. S. Allison in 2001 dumped 37 in rain on Houston • Hilly topography affects rainfall; H. Agnes 1972 in Appalachian Mtns of eastern United States • High winds • Direct damage • Storm surge
Categories of Cyclones • Wind damage • Category 1: 74 – 95 mph • Category 2: 96 –110 mph • Category 3: 111 – 130 mph • Category 4: 131 – 155 mph • Category 5: > 155 mph • Highest recorded winds – 190 mph • Eyewall has highest velocity; landfall location important
Insurance • Flood insurance $300 per year • Wind and hail damage - $2,100 per year • Additional add on to cover roof damage • Both required by bank for lending • Deductible is 10 per cent of home value, so for a $300,000 home it is $30,000; amount goes to 15% if the storm has a name • If a dead tree fall into your property, the owner of the tree is liable; if it is a live tree, you pay! Ha!
Major hurricane hazard map Highest Second highest
Most costly storms in U.S. $50 billion Sandy 2012